I started a new math art project today and just couldn’t stop. Basically I’m dreading going back to school soon, but didn’t want to mope all day and waste it. So the day turned into a day of learning new things.
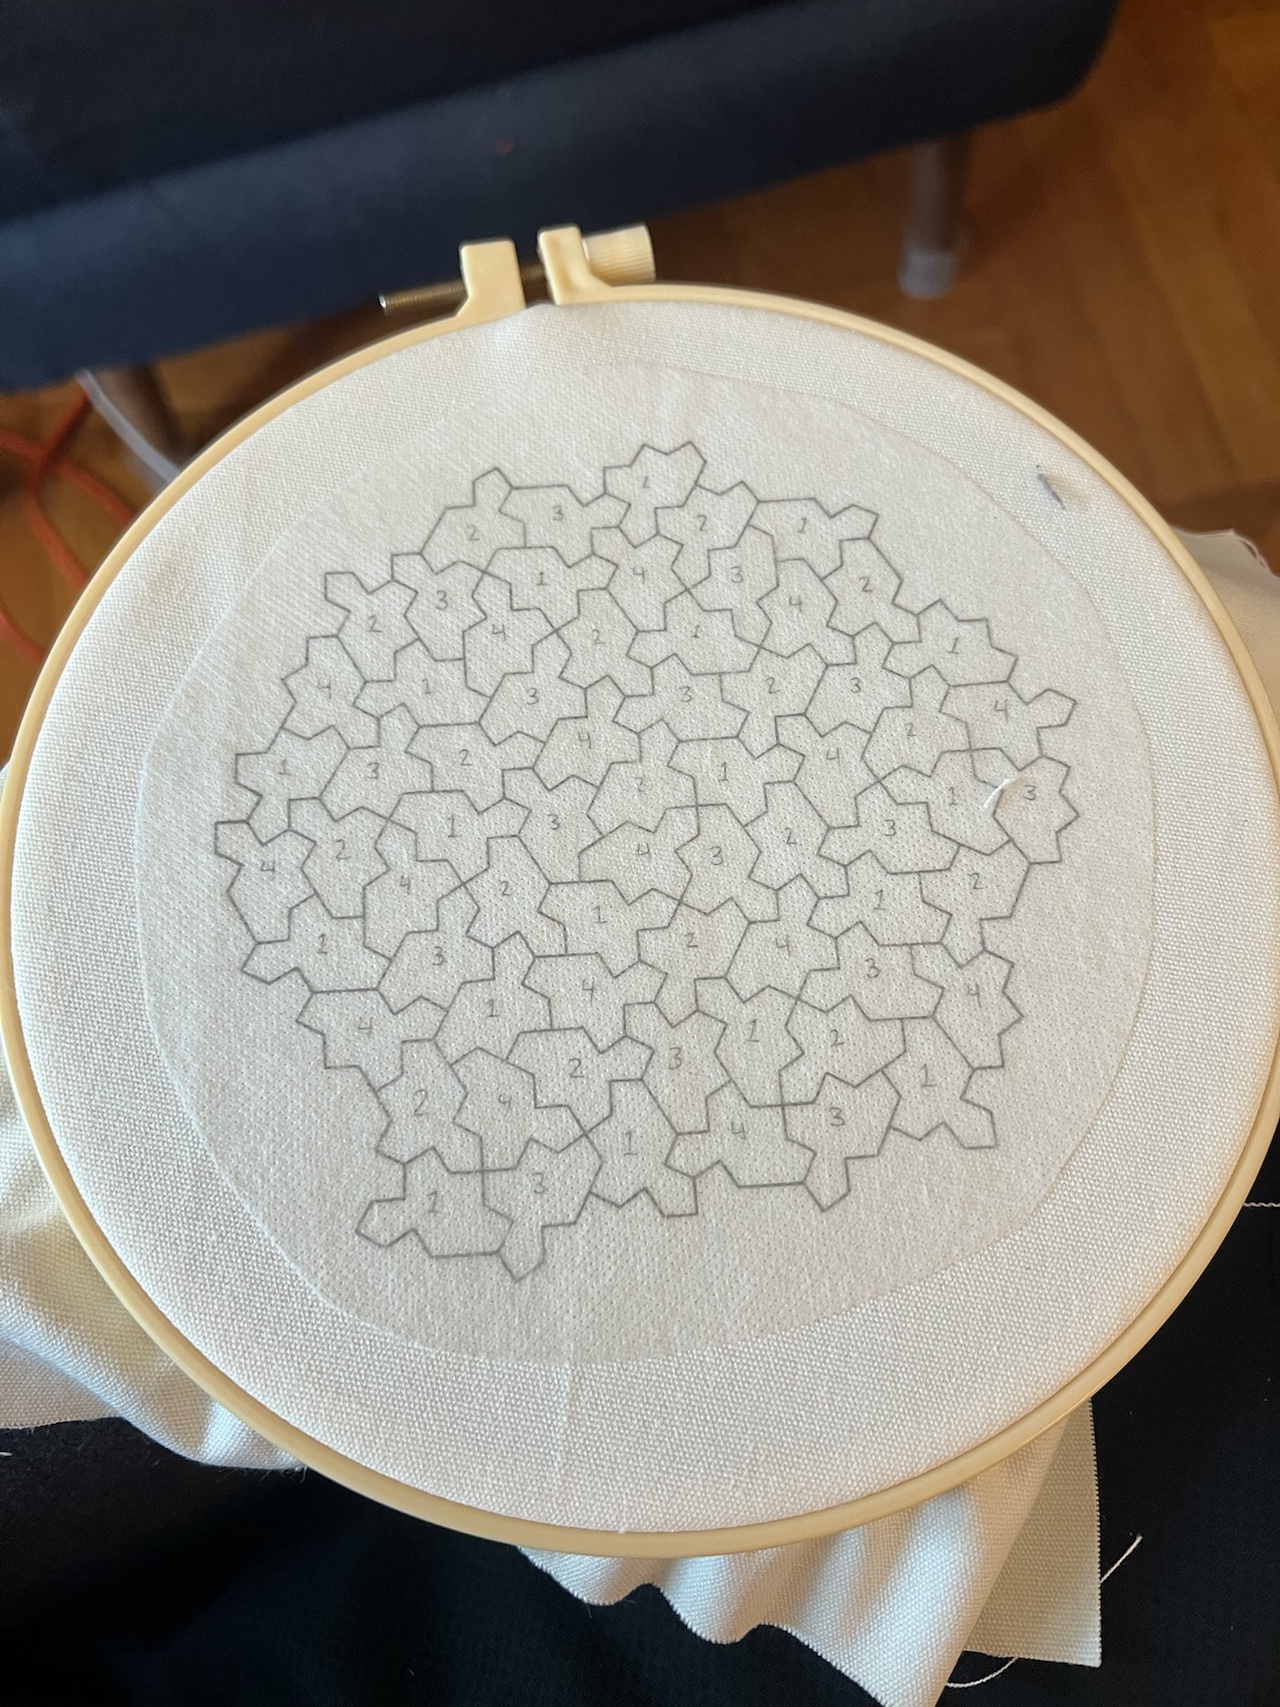
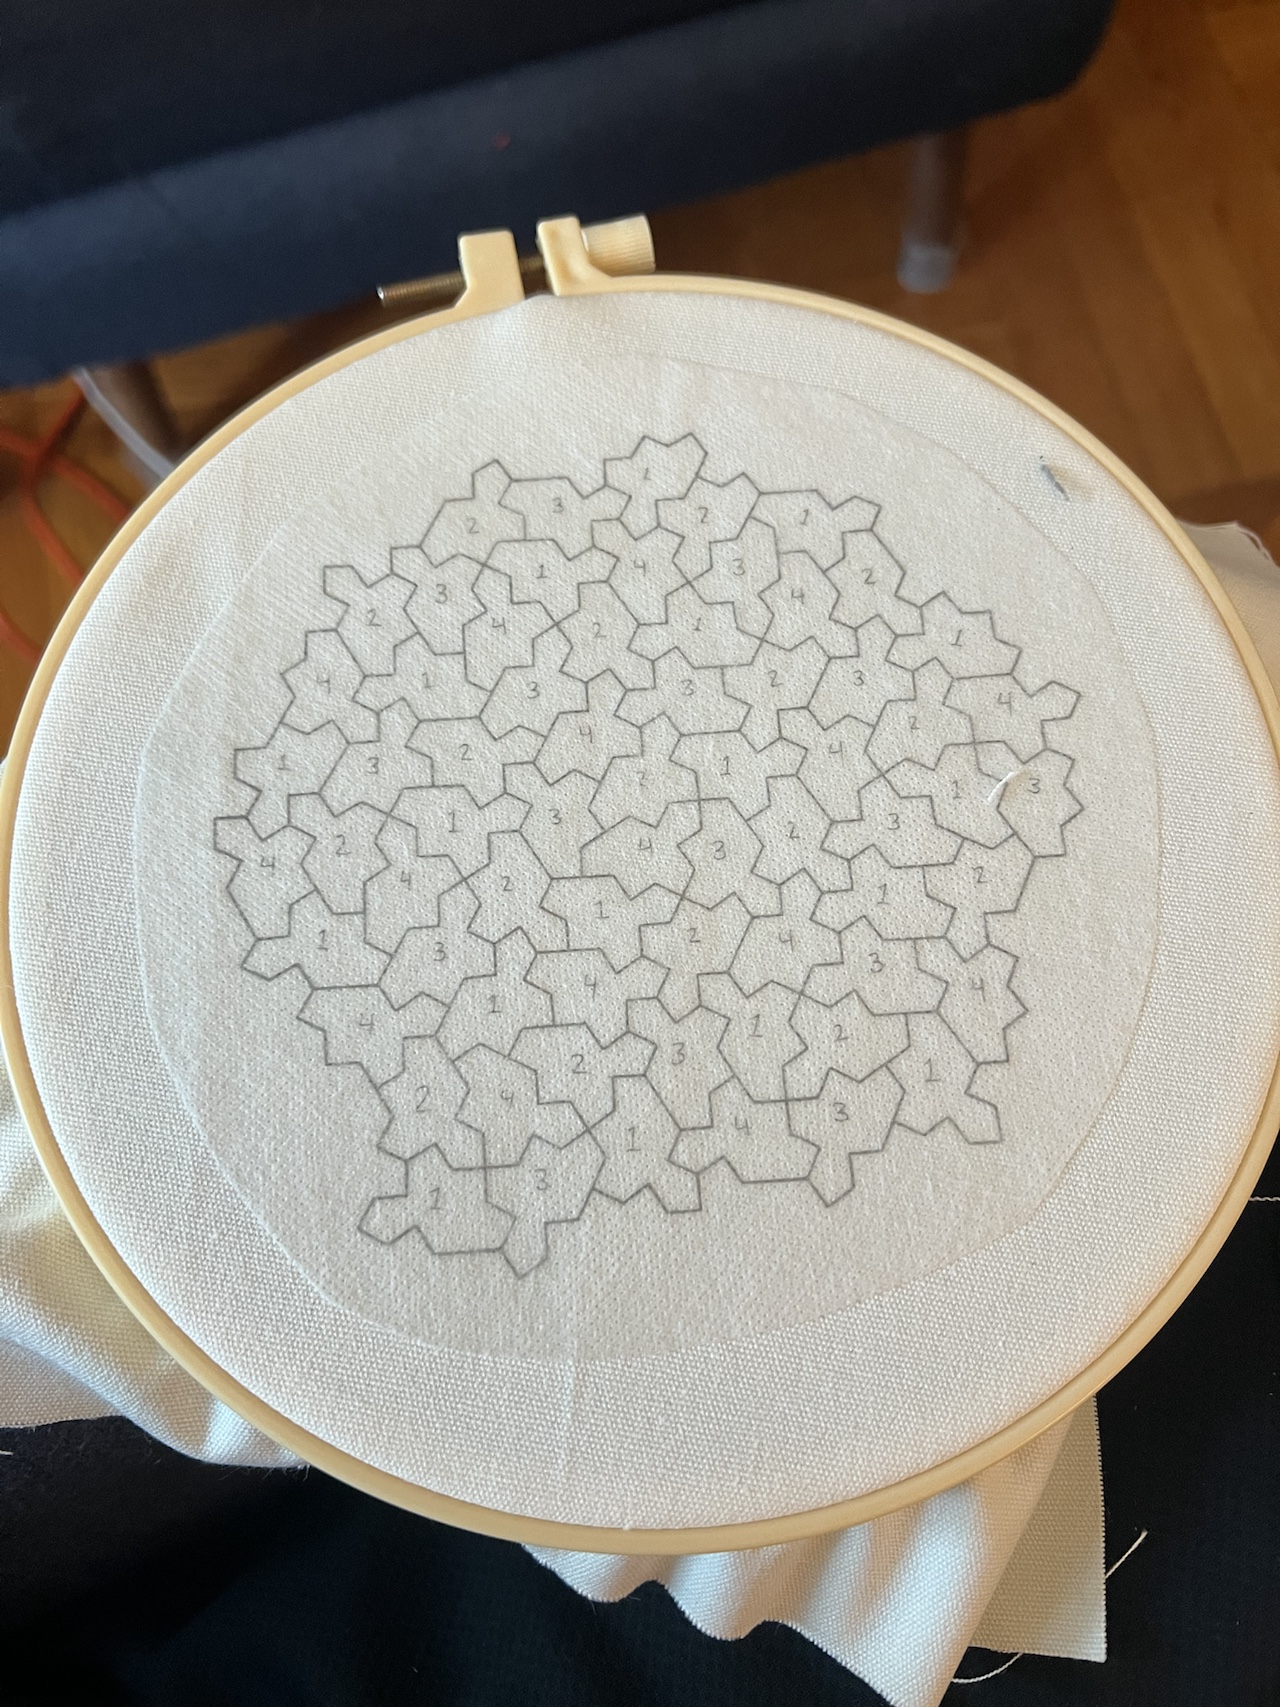
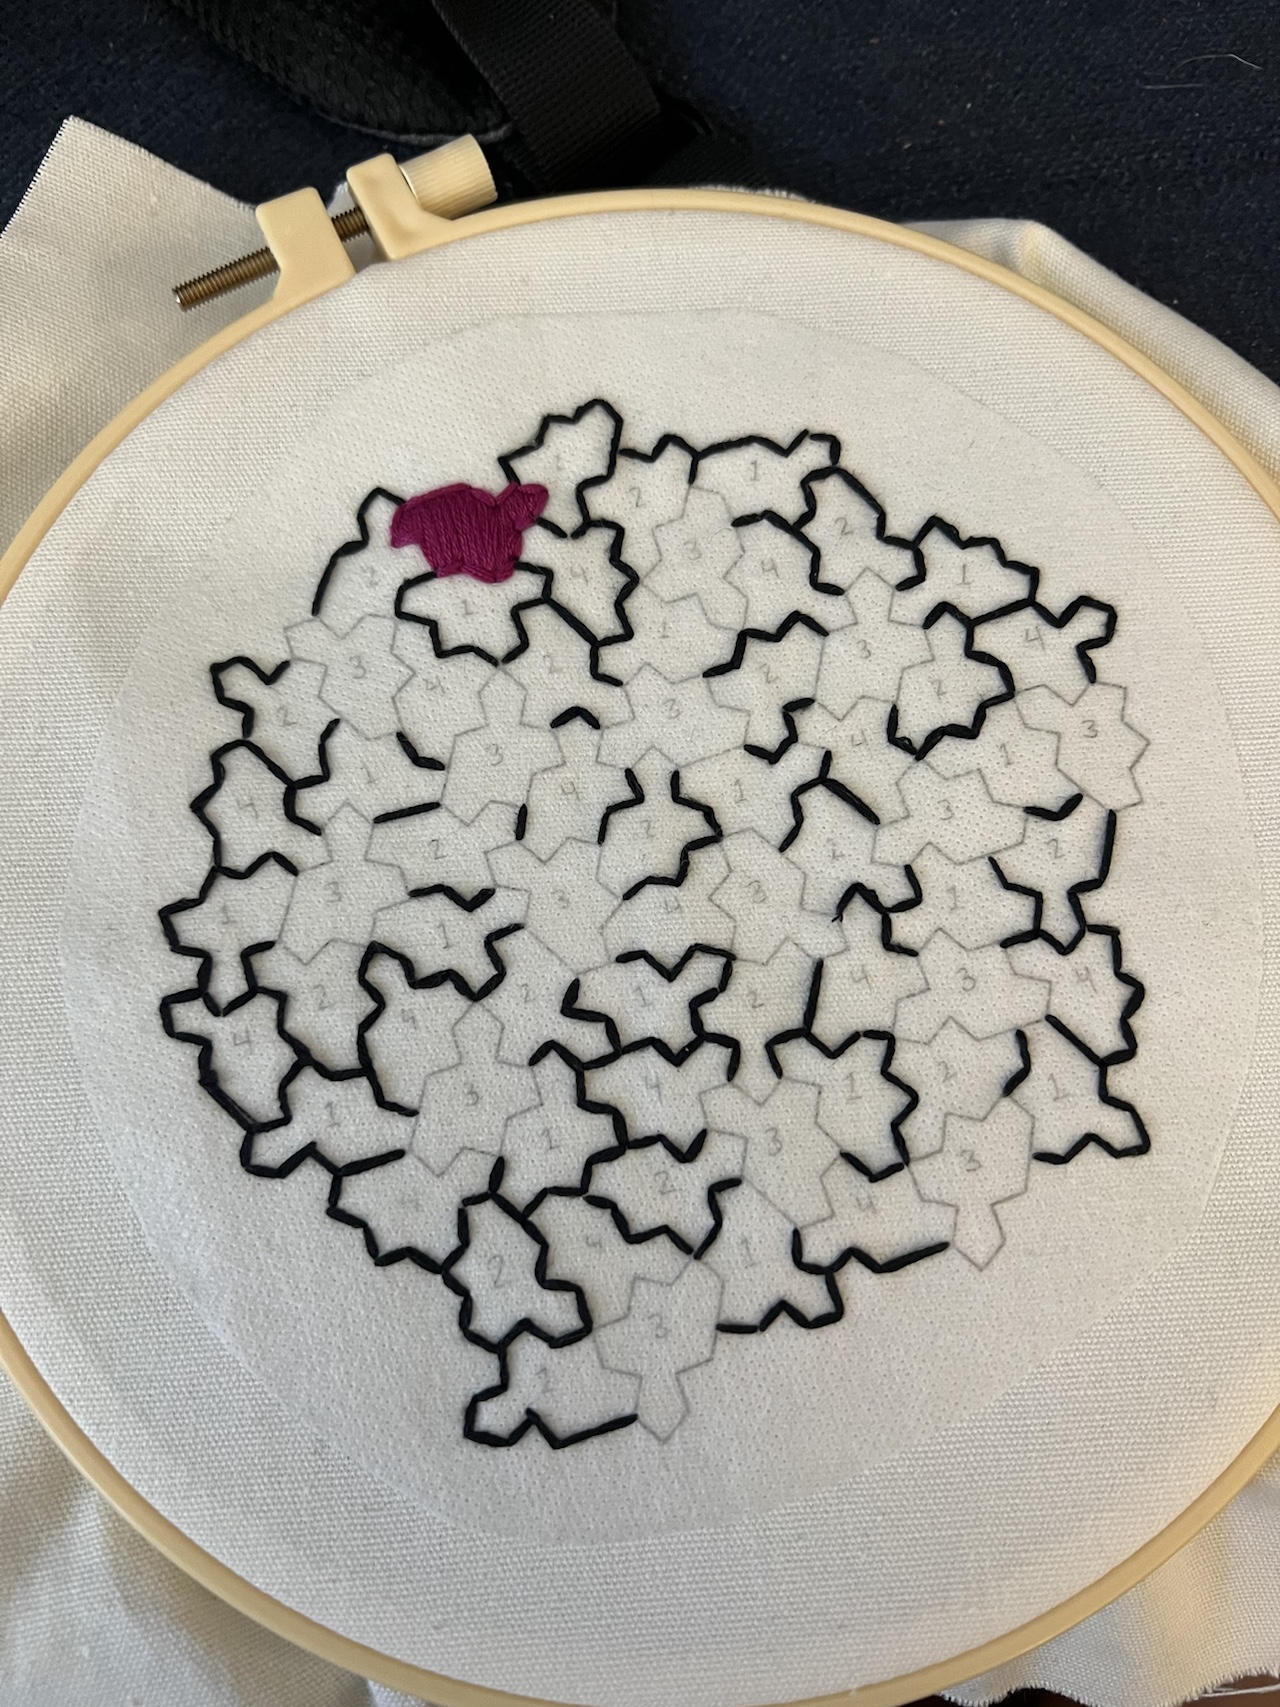
Right now my project is drying so I don’t have a final photo yet. Here it is before I got it wet. (It still has the water-soluble transfer paper on it in the photo.)
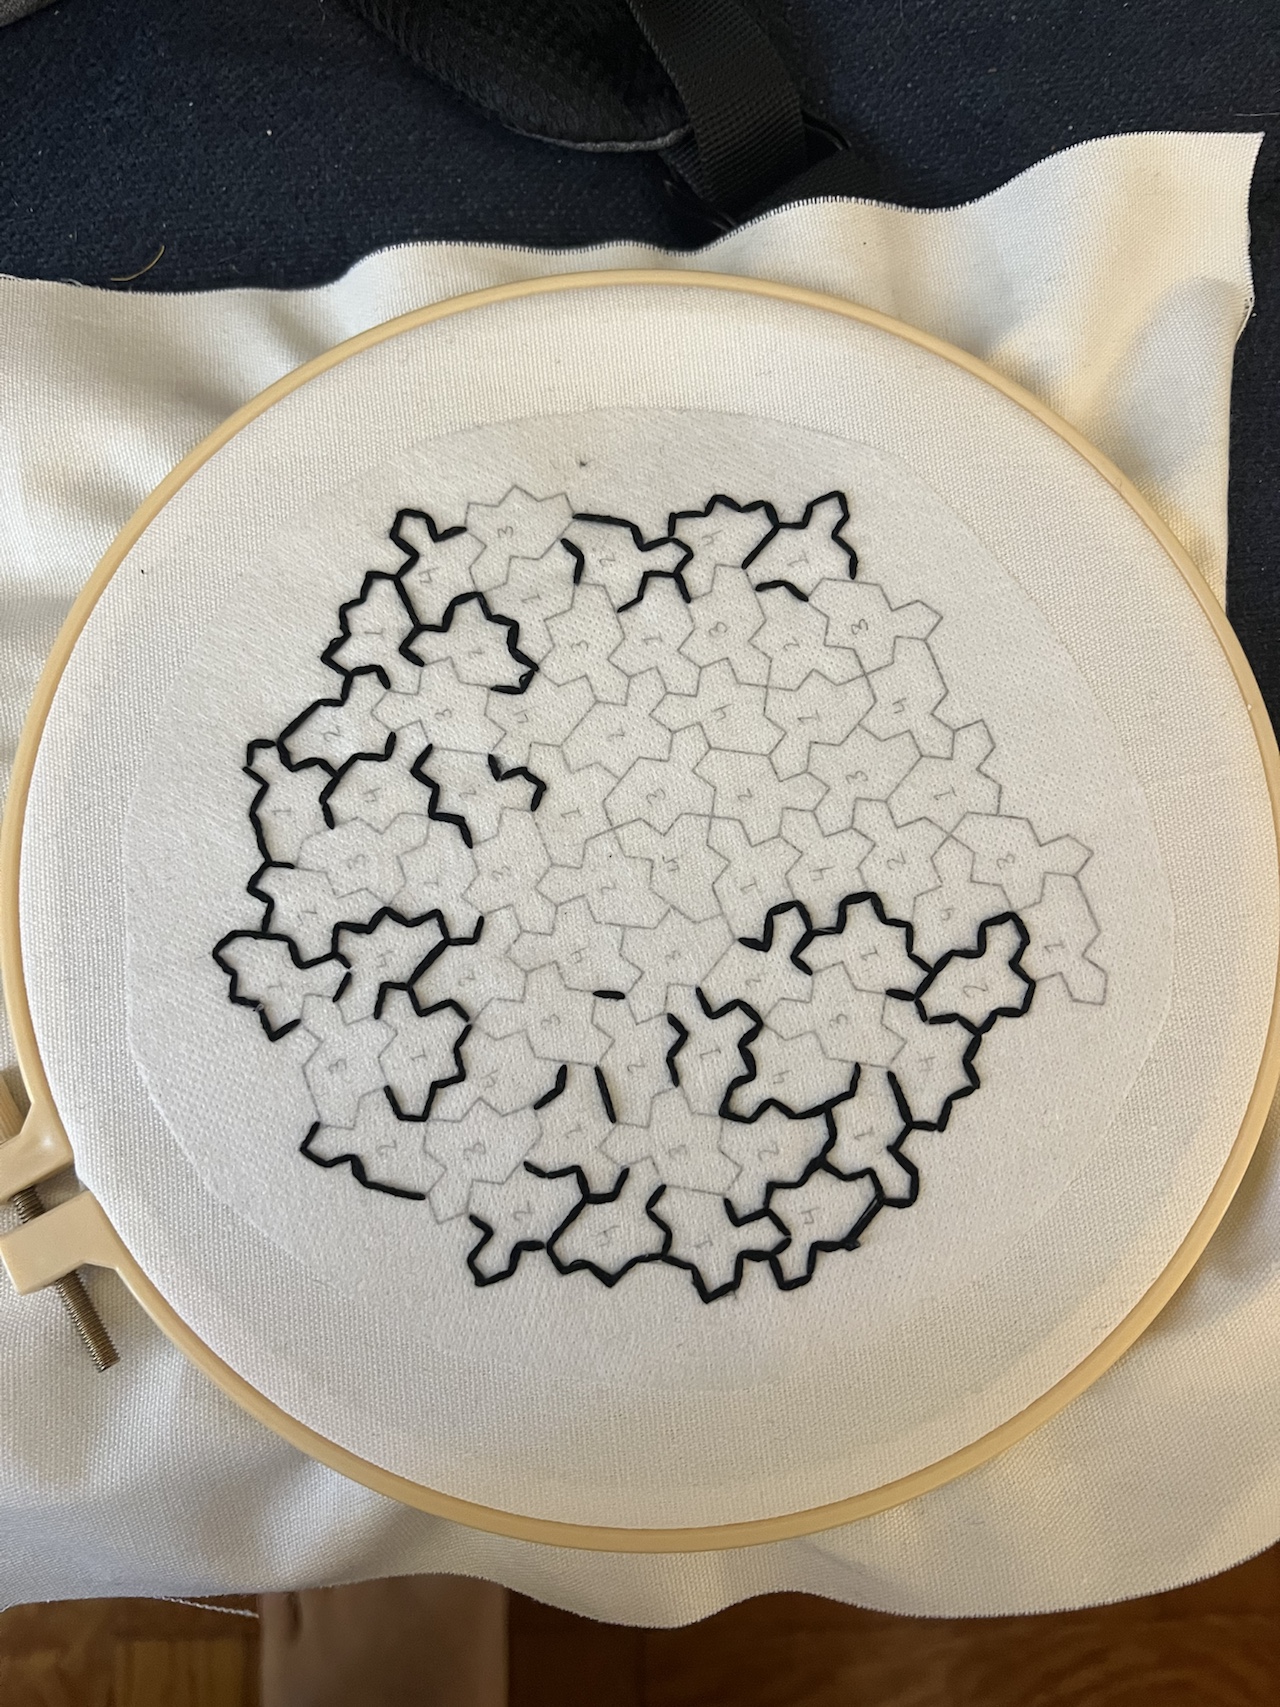
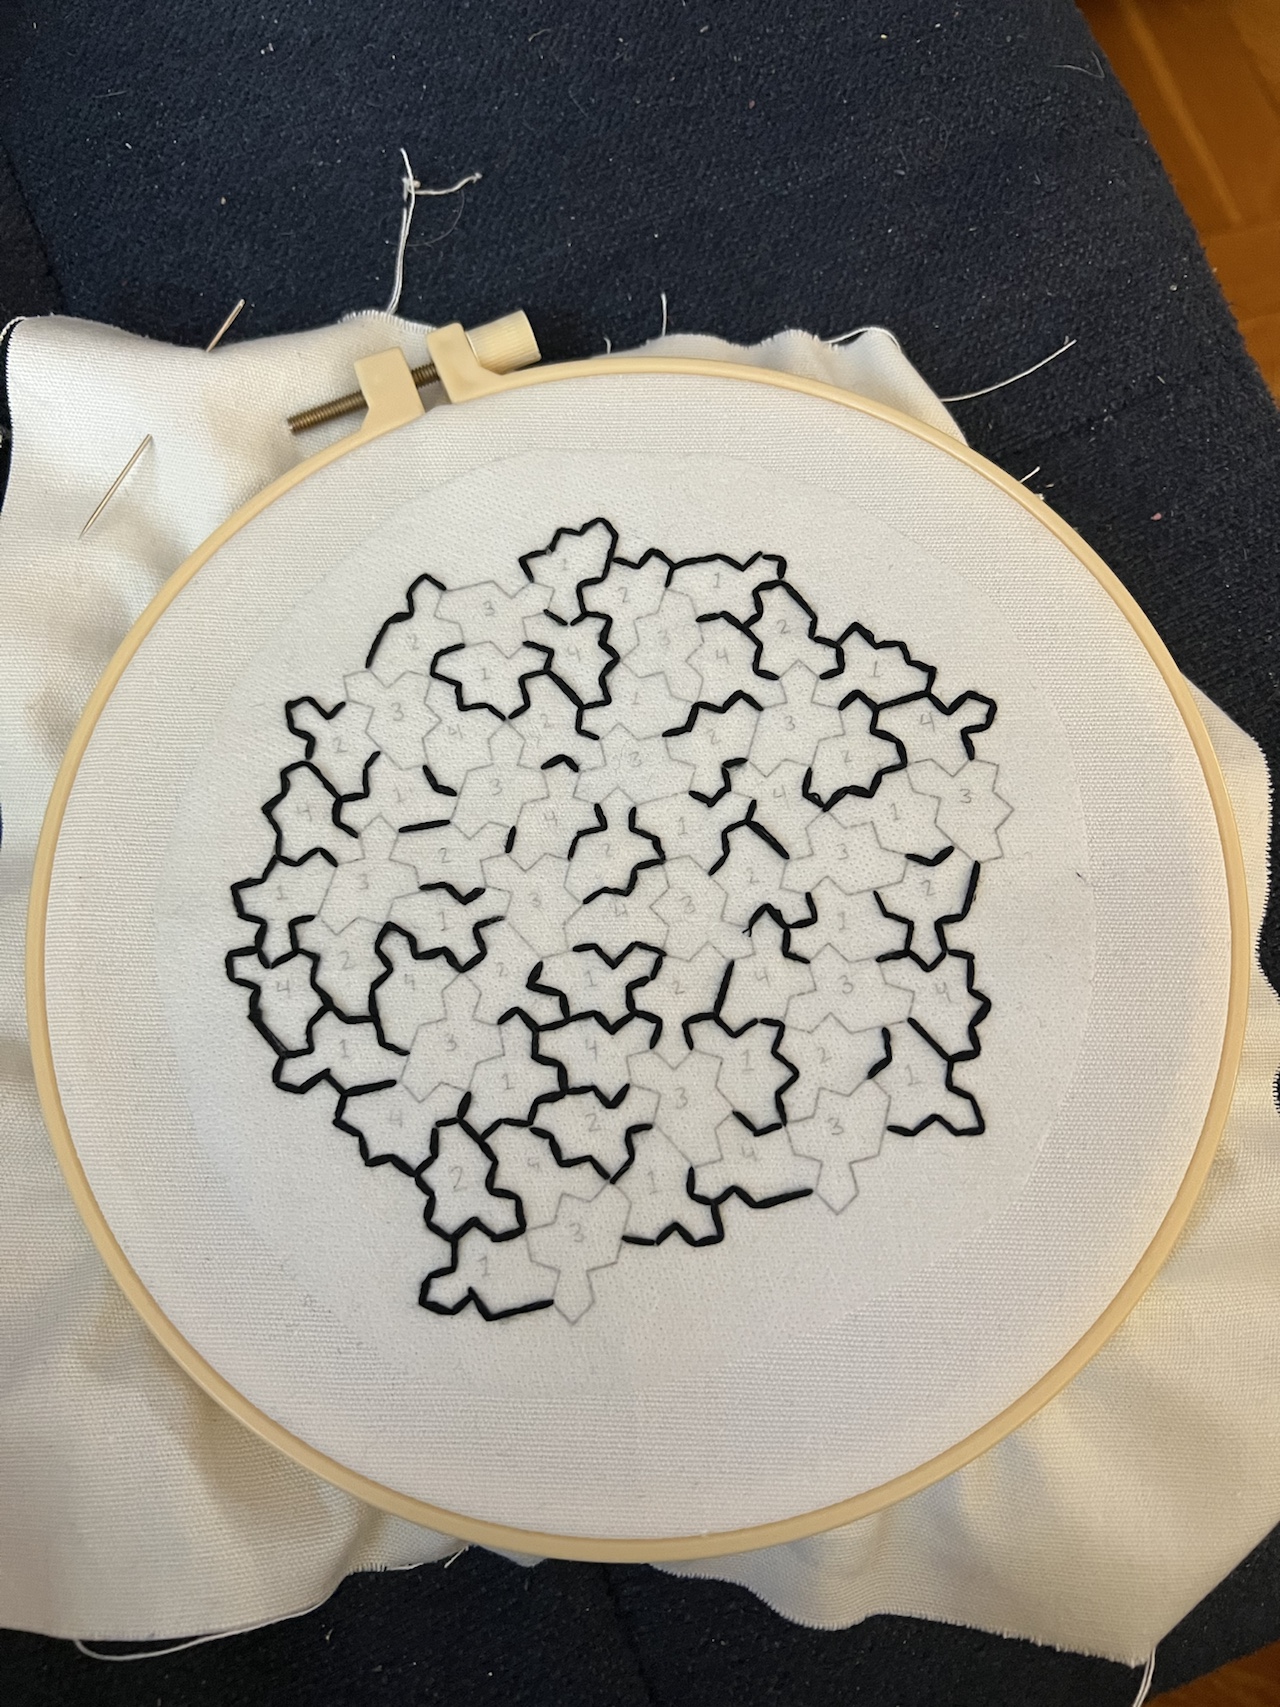
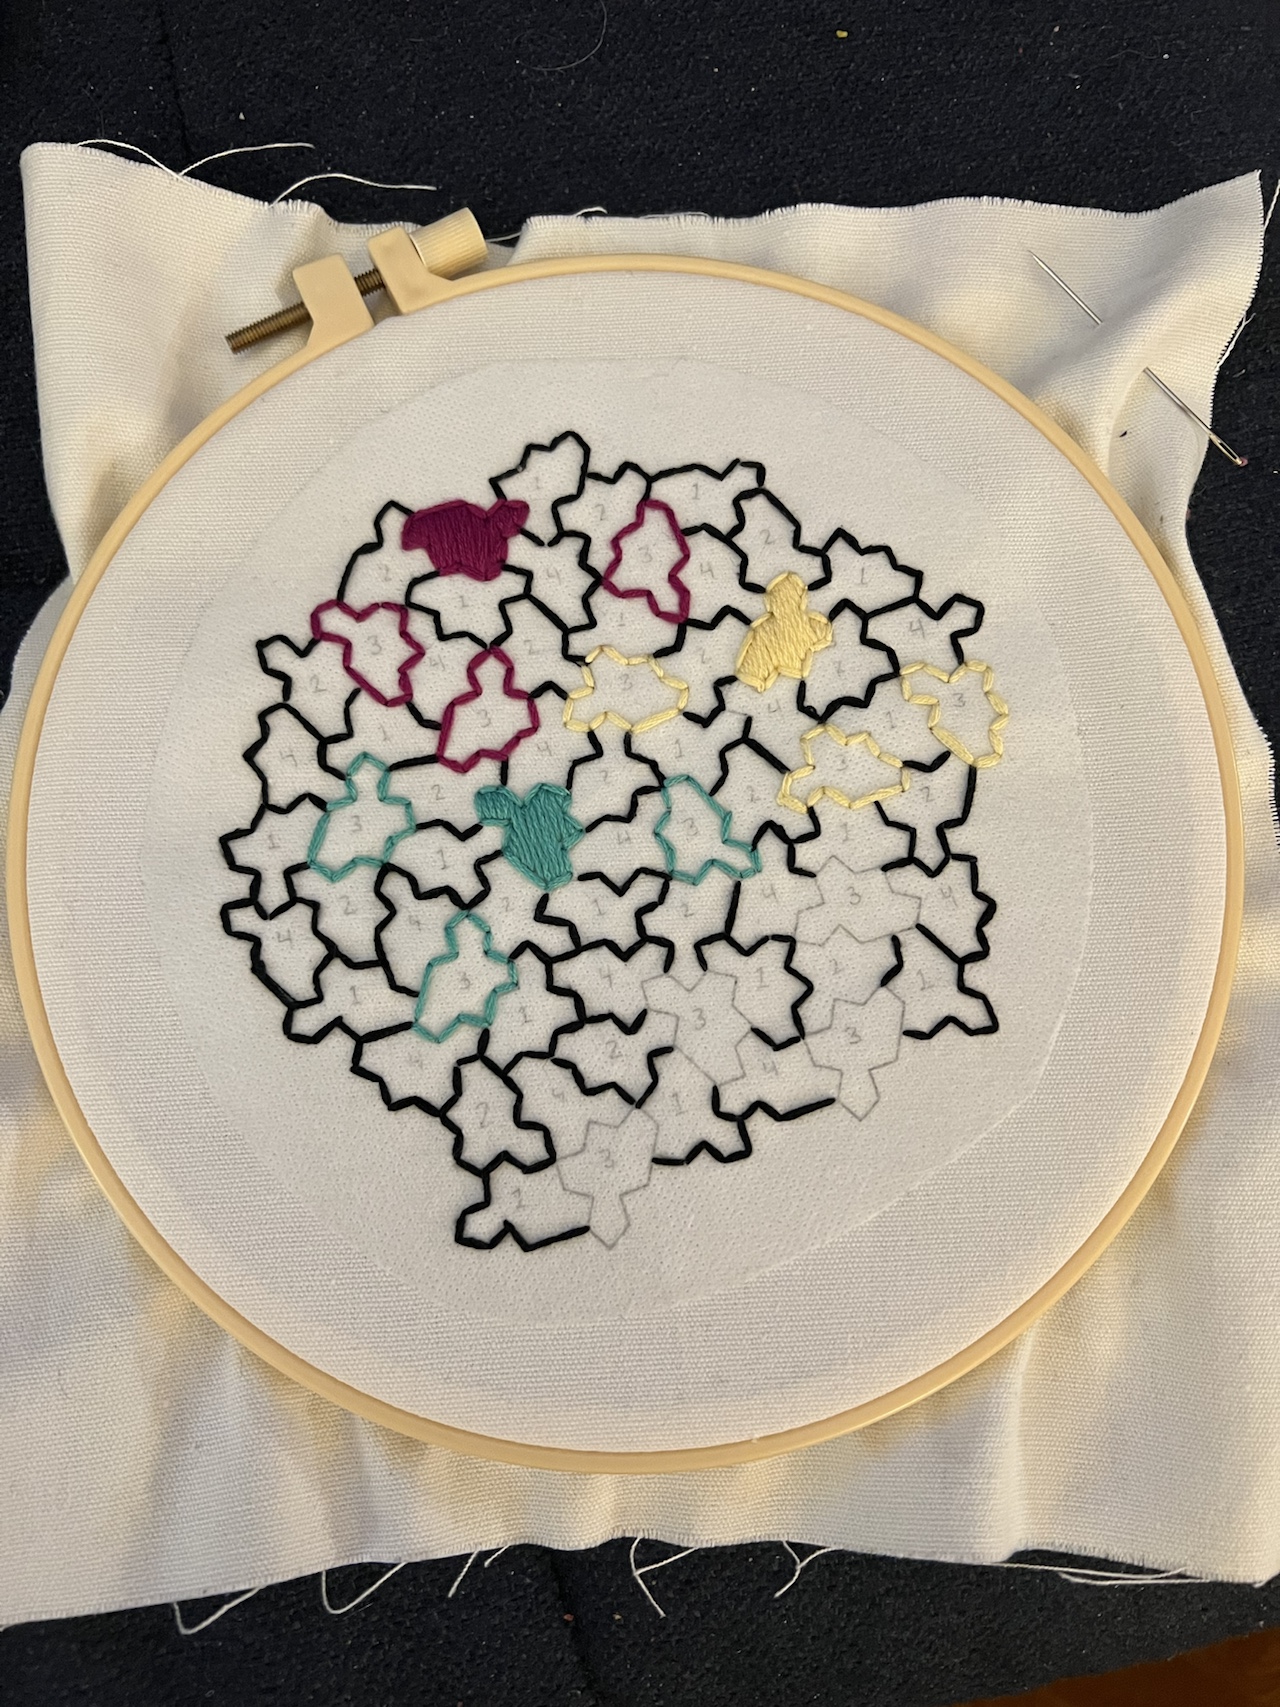
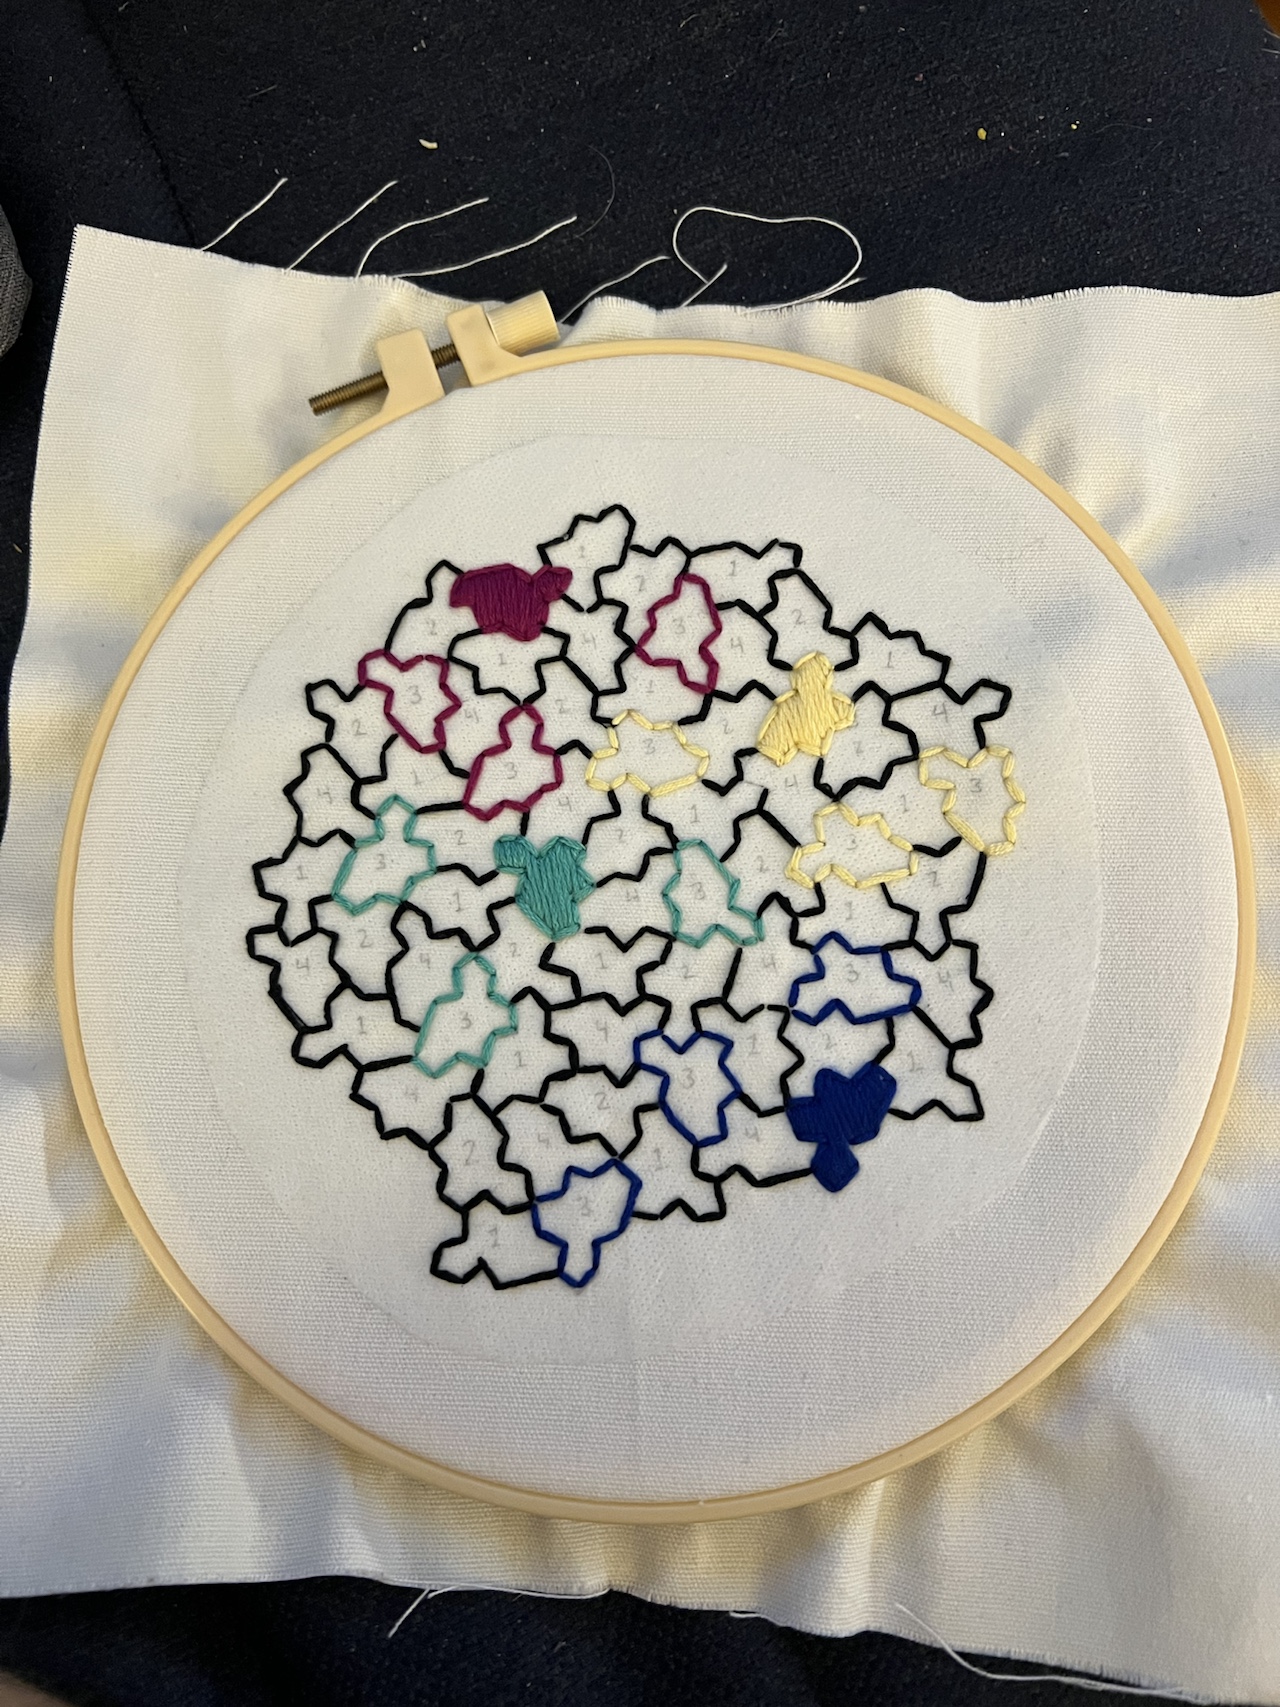
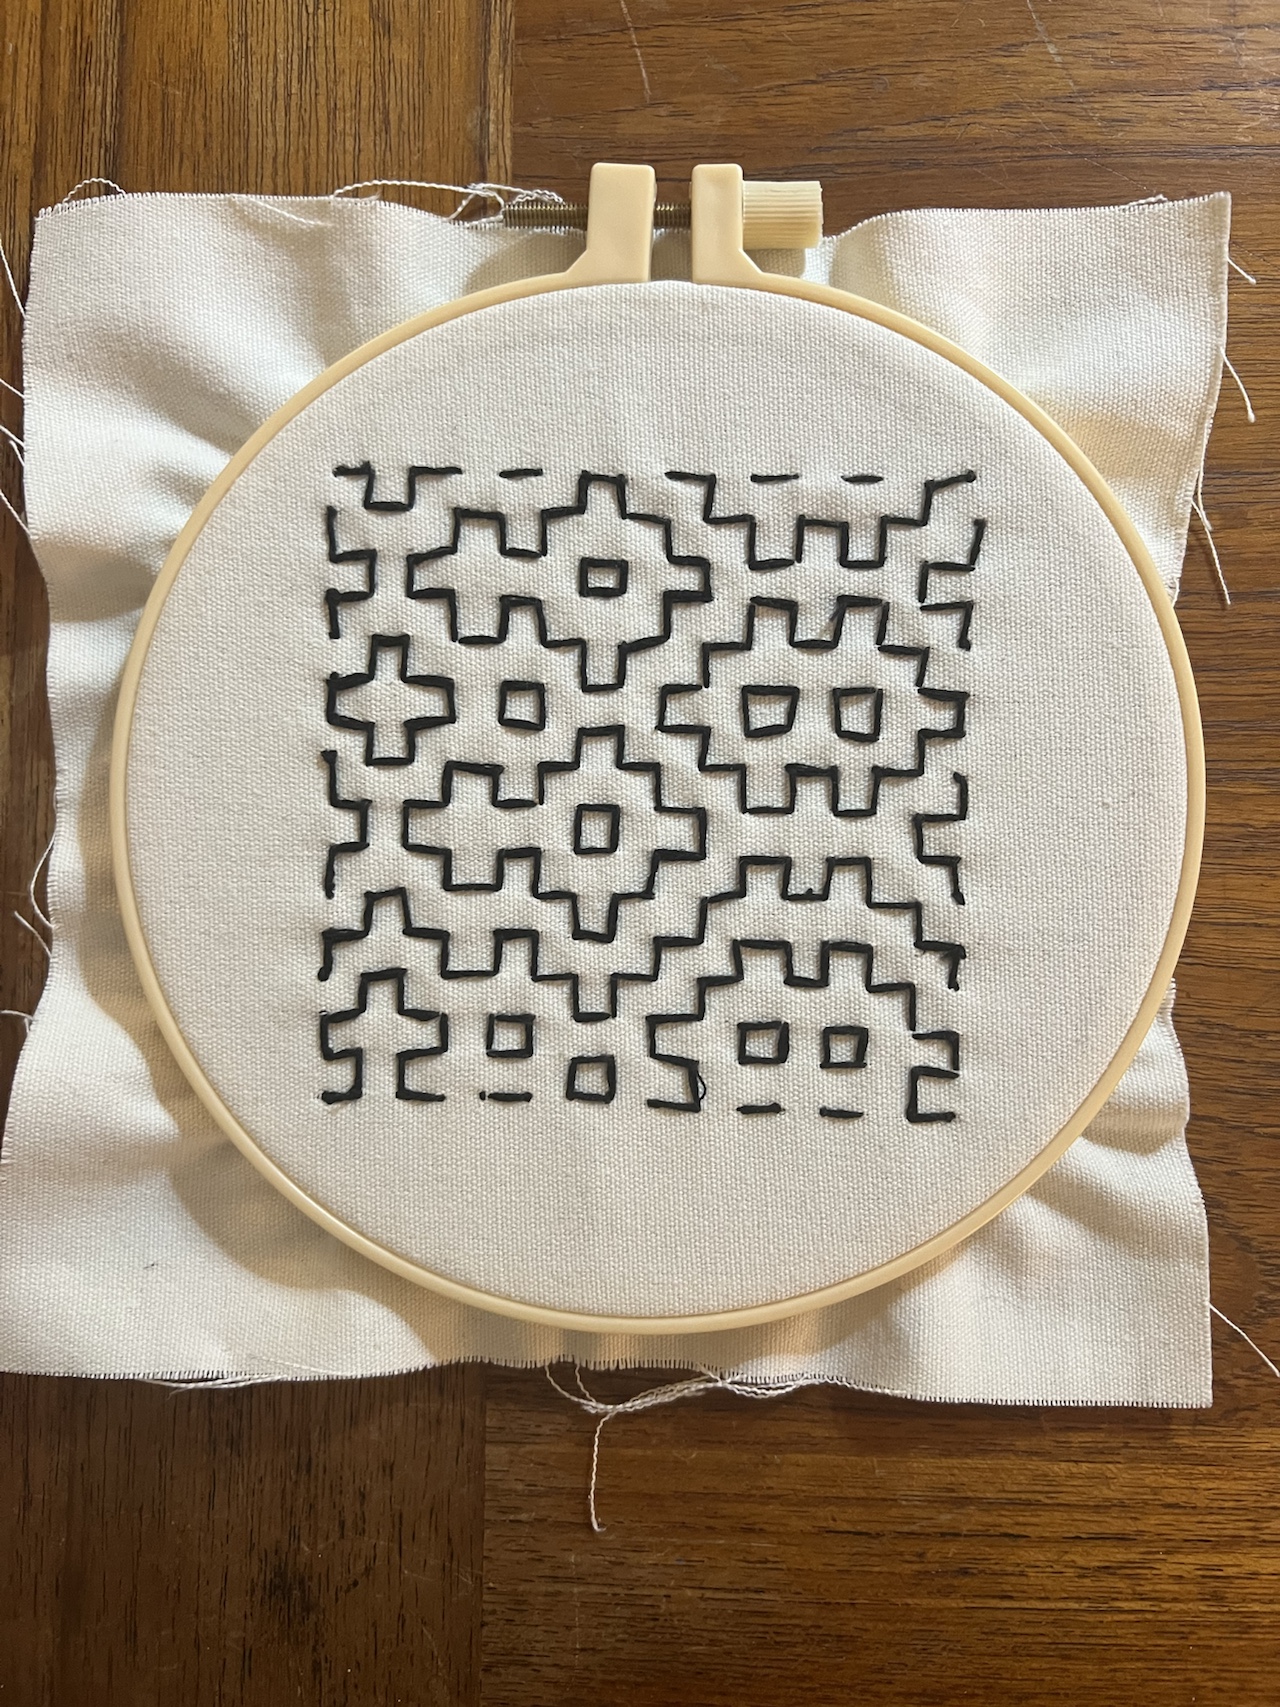
Update: Here’s the photo now that I’ve removed the water soluble transfer paper.
Earlier today I typed “embroidery math” in Google and a site called Threaded Theorems popped up. Nary a second passed before I was on the site. With a website name like that! I saw the instructions for embroidering the aperiodic monotile called the “hat tile.”
Technically what I embroidered uses a slight variant of the “hat tile,” because that tile requires the shape and its reflection when filling the plane, and this variation in the embroidery does not require its reflection. Just a single tile, repeated over and over again, but creating something that fills the plane but doesn’t have translational symmetry! (The variant tile is known as “the spectre.”) And this is modern math! It only was discovered in 2023!
I literally know nothing about embroidery so I’m learning and doing things on the fly. In this project the instructions had me learn the backstitch and satin stitch.
And if you want more technical definition of aperiodic tilings, and some really pretty pictures, here’s the wikipedia page!
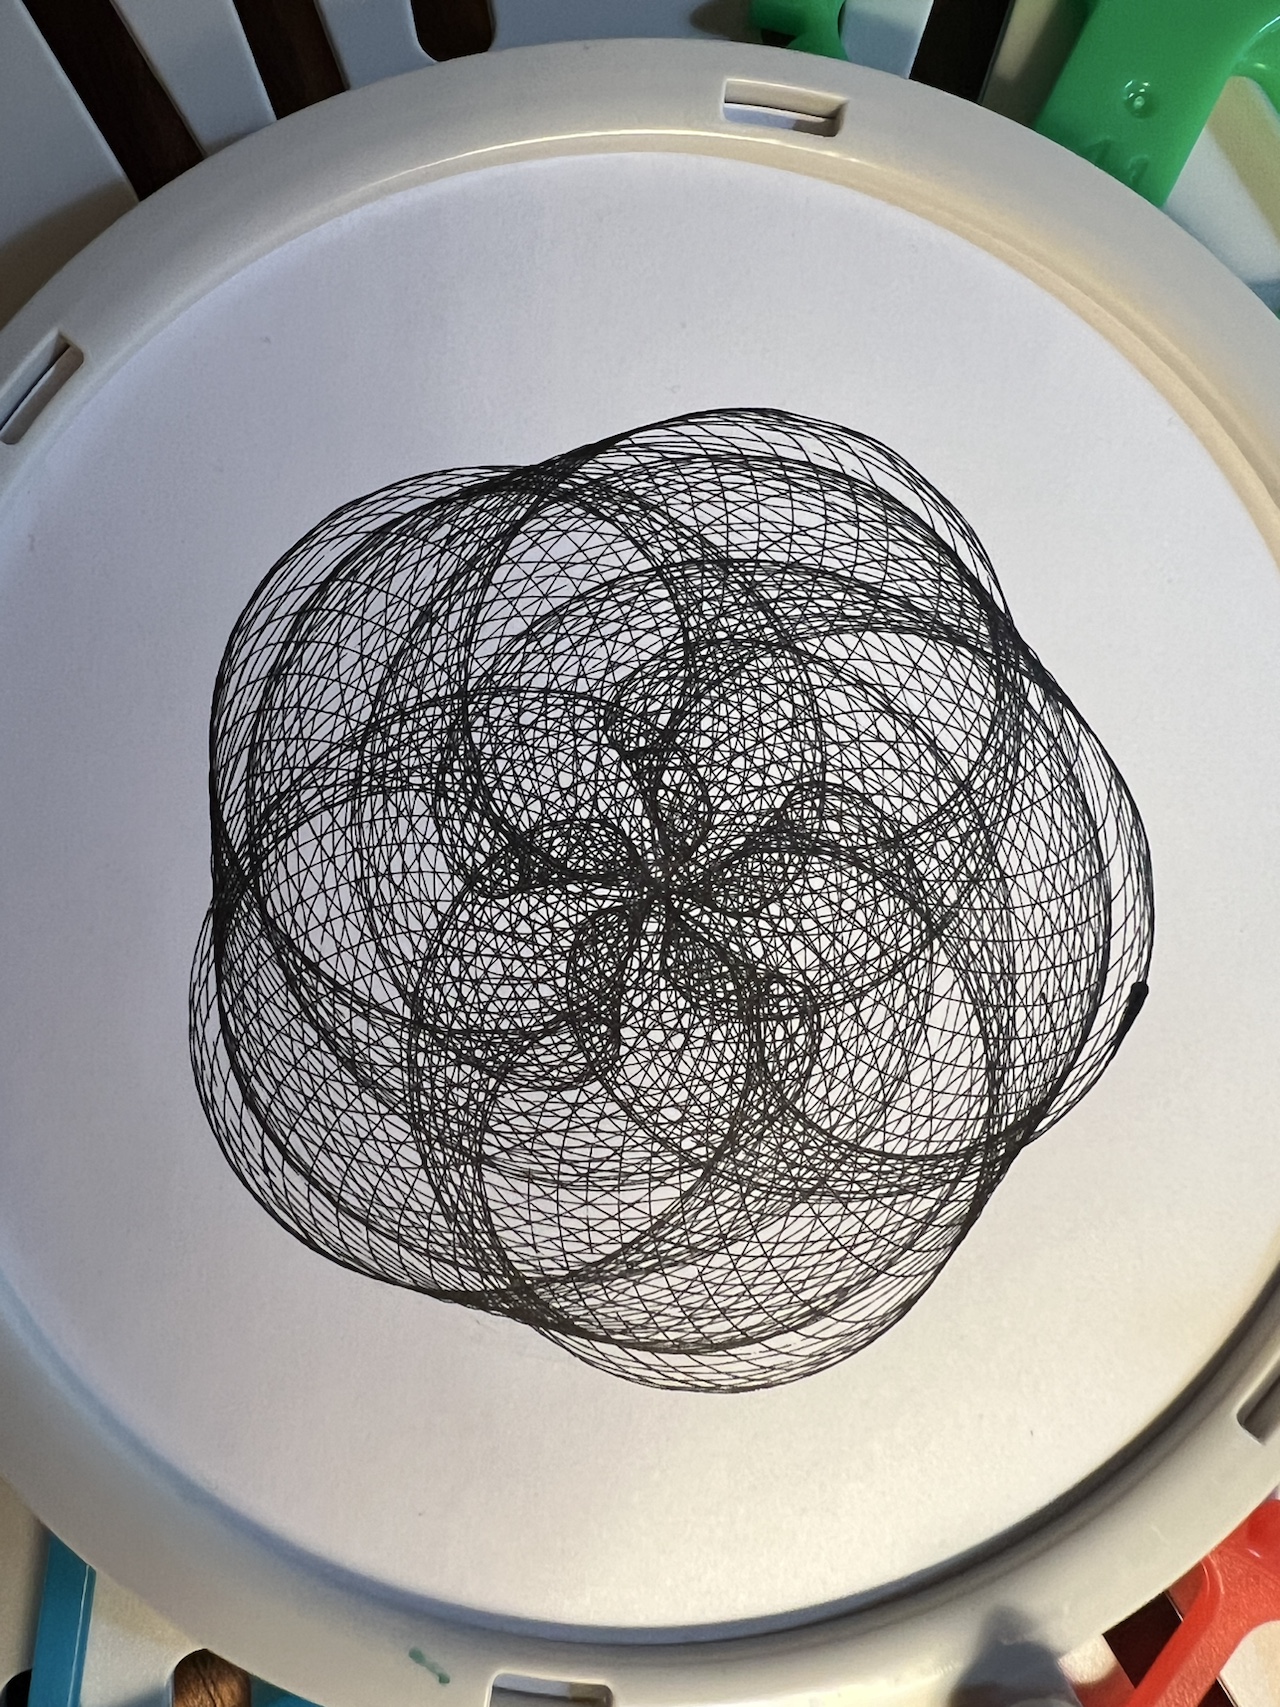
Ages ago, I kickstarted the “hypnograph” which is a cycloid drawing machine.
I tried to get it to work when it arrived, but for some reason, I couldn’t get the drawings to work out. (The instructions that it came with were okay but there were bits that could have been much clearer.) However I found this box in my closet a few days ago, and decided to try again. And it worked!
Here are some drawings I’ve created:
You can see the machine in action in this youtube video [starting at time 4:53]:
Of course I wanted to somehow mathify this. In fact, I’ve never even mathified sprigraph before (though I’ve seen some people derive the equations, but I’ve never tried to do it on my own)! I decided to jump right in and see: can I come up with equations for the final graph, given all the components of the machine?
It was harder than expected, and I had moments of frustration and felt like I wanted to quick. It took me a couple days. I first started doing all this algebra on paper, and realized that was not going to work because the equations got gross. So instead, I went to Desmos and everything became much easier.
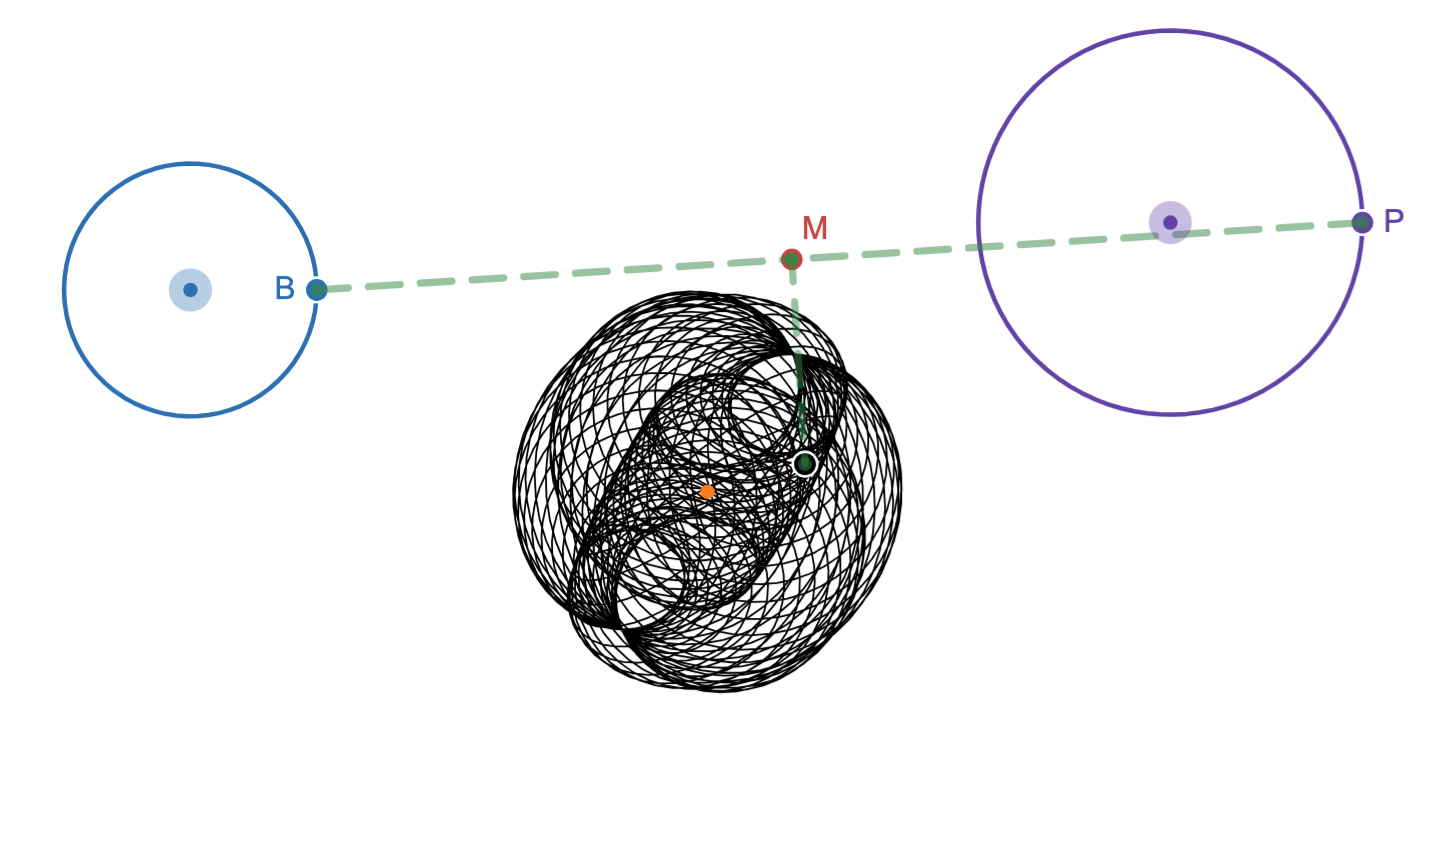
Without going into too many details, here’s my setup in Desmos, and a picture of the hypnograph, so you can see the connections:
I have point B spinning around a circle/gear (and you can change the location, the rate of rotation, and size of the circle/gear), Similarly I have point P spinning around a second circle/gear (with the same things changeable). The arm that connects B and P is fixed at point B, and slides at point P (like with the machine). (I’d watch the video above to see the difference between the fixed point and the sliding point. In that video, the fixed point is on the red gear and the sliding point is on the green gear.)
Initially, I had Desmos plot just the pen location. It was creating some really pretty drawings, but it didn’t mimic what I saw on the hypnograph itself. The hypnograph images always have some sort of symmetry, and my final result didn’t always have that symmetry.
I posted my Desmos and a video of the machine working on Bluesky to see what I was missing. I knew I just needed fresh eyes to show me what I was blind to. And diffgeom clocked it (and dandersod agreed)!
Not sure this is the only issue (and have not checked your model), but the paper is rotating relative to the table (and therefore relative to the rods holding the pen), while on your screen it appears not to be…?
YEESH! I forgot to have the paper rotate as the pen was drawing! ACK! But thinking about that hurt my brain. I came up with one solution, and tried to implement it, and that failed. But with some perseverance, I came up with a solution and I think it works! [1]
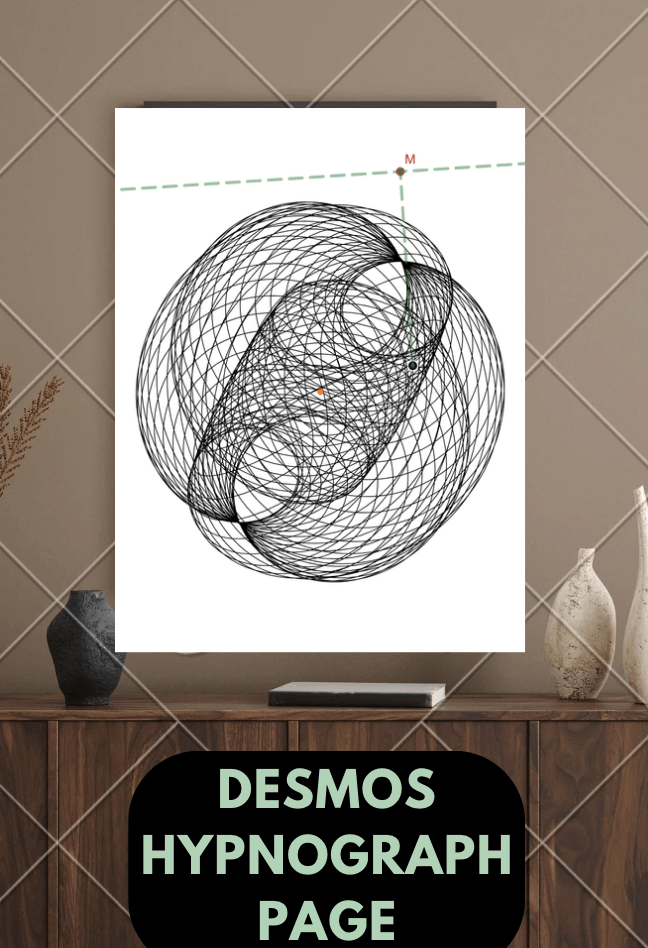
Here’s an image from my Desmos sheet to show you what it produced:
And if you want to play with the Desmos sheet, change the gear sizes, the length of the two arms, and the speed of the gears and rotating paper to see the various results, here you go! Click on the random image below I made in Canva, and press play. It’ll look like garbage at first as it’s drawing and then suddenly you’ll see how cool it looks!
Now I should qualify to say I’m not 100% sure this is perfectly correct. But I wanted to share what I had because I’m proud of it. And it was fun! And if I don’t write it down, I’ll never have a record of working on this project!
Archiving for later: These youtube videos [one, two] are great for getting a sense of the machine and how to modify it so it works the best.
[1] A bit of an aside/archive that won’t make sense to anyone not in my head: Essentially I realized I was doing a hack for polar coordinates but not allowing r to be 0. So it was graphing the right equations but having all negative r graph as positive r. When I realized that, I finally figured out what I needed to do. I made the center of the spinning paper (0,0). That had to be fixed. Then I had the coordinates for the pen. So I put those coordinates through a rotation.
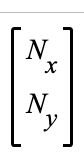
The pen location was at this point:
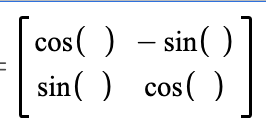
So to make the equivalent marking on a moving paper, I multiplied it by the rotation matrix (where the rotation matrix was filled with values that had the wheel rotate at a certain rate):
Which got me the pen location after it had been rotated! In my Desmos page, that turns out to be:
Honestly I was really proud of this solution! And what I love about all this work is it incorporates all the stuffI teach in precalculus… polar coordinates and rotation matrices FTW! We stopped teaching much about vectors, but I used a bunch of vector thinking in this also!
I’m going to be teaching a mini-course (7 days) on math-art in this upcoming school year. In my work on that course this summer, I started thinking about how I can have kids work with embroidery hoops and floss. And unrelated, this morning, I was thinking about a quilt my high school friend made for me and gave me yesterday. What a special gift from a truly special friend!
When thinking about the quilt, I started thinking about Truchet tiles and how those could create some beautiful patterns for quilts. And then the pictures of Truchet tiles reminded me of a series of posts that come on my feed regularly by the Hitomezashi Bot on Bluesky, created by Alien_Sunset.
So I went to that bot, which led me to the creator’s website (which is here), and finally I found the Hitomezashi page here. That page led me to this Numberphile video with Ayilean (a creator who I adore):
A method of specifying hitomezashi designs in shorthand form using binary strings was employed by the first author when she proposed an activity for the Math Art Challenge organized by Annie Perkins (Perkins, Citation2020). The premise of the Challenge was to provide, each day for 100 days, an activity which could be done during lockdown or remote learning with materials on hand. Hence it was suggested that hitomezashi designs could be drawn on graph paper, if sewing materials were not available; some participants chose to render them using their preferred software. Three ways to choose the binary strings were suggested: to intentionally create regular patterns by repetition (which we explore in this paper), by flipping a coin (thus making aleotoric art) or as a form of steganography (e.g. by using the ascii representation of letters).
The Math Art Challenge hitomezashi activity created a lot of interest on Twitter; subsequently, a Numberphile video featuring Ayliean MacDonald took the drawing idea to an even wider audience and explored the steganographic and aleotoric aspects (Haran, Citation2021). This video came to the attention of Defant and Kravitz (Citation2022), who have subsequently proved a number of results about arbitrary hitomezashi designs…
And FULL CIRCLE! When I got here, my heart was twitterpated because the authors talked about Annie Perkins and her 100 Day math-art challenge. I KNOW ANNIE! And I love Annie’s work so much! And so I found her math-art challenge from Day 14.
Just from googling “hitomezashi math” there are a ton of hits. I love seeing how the simple setup of the hitomezashi activity can lead to some really interesting patterns, observations, and questions/conjectures.
So what did I do? I HAD TO MAKE ONE MYSELF!
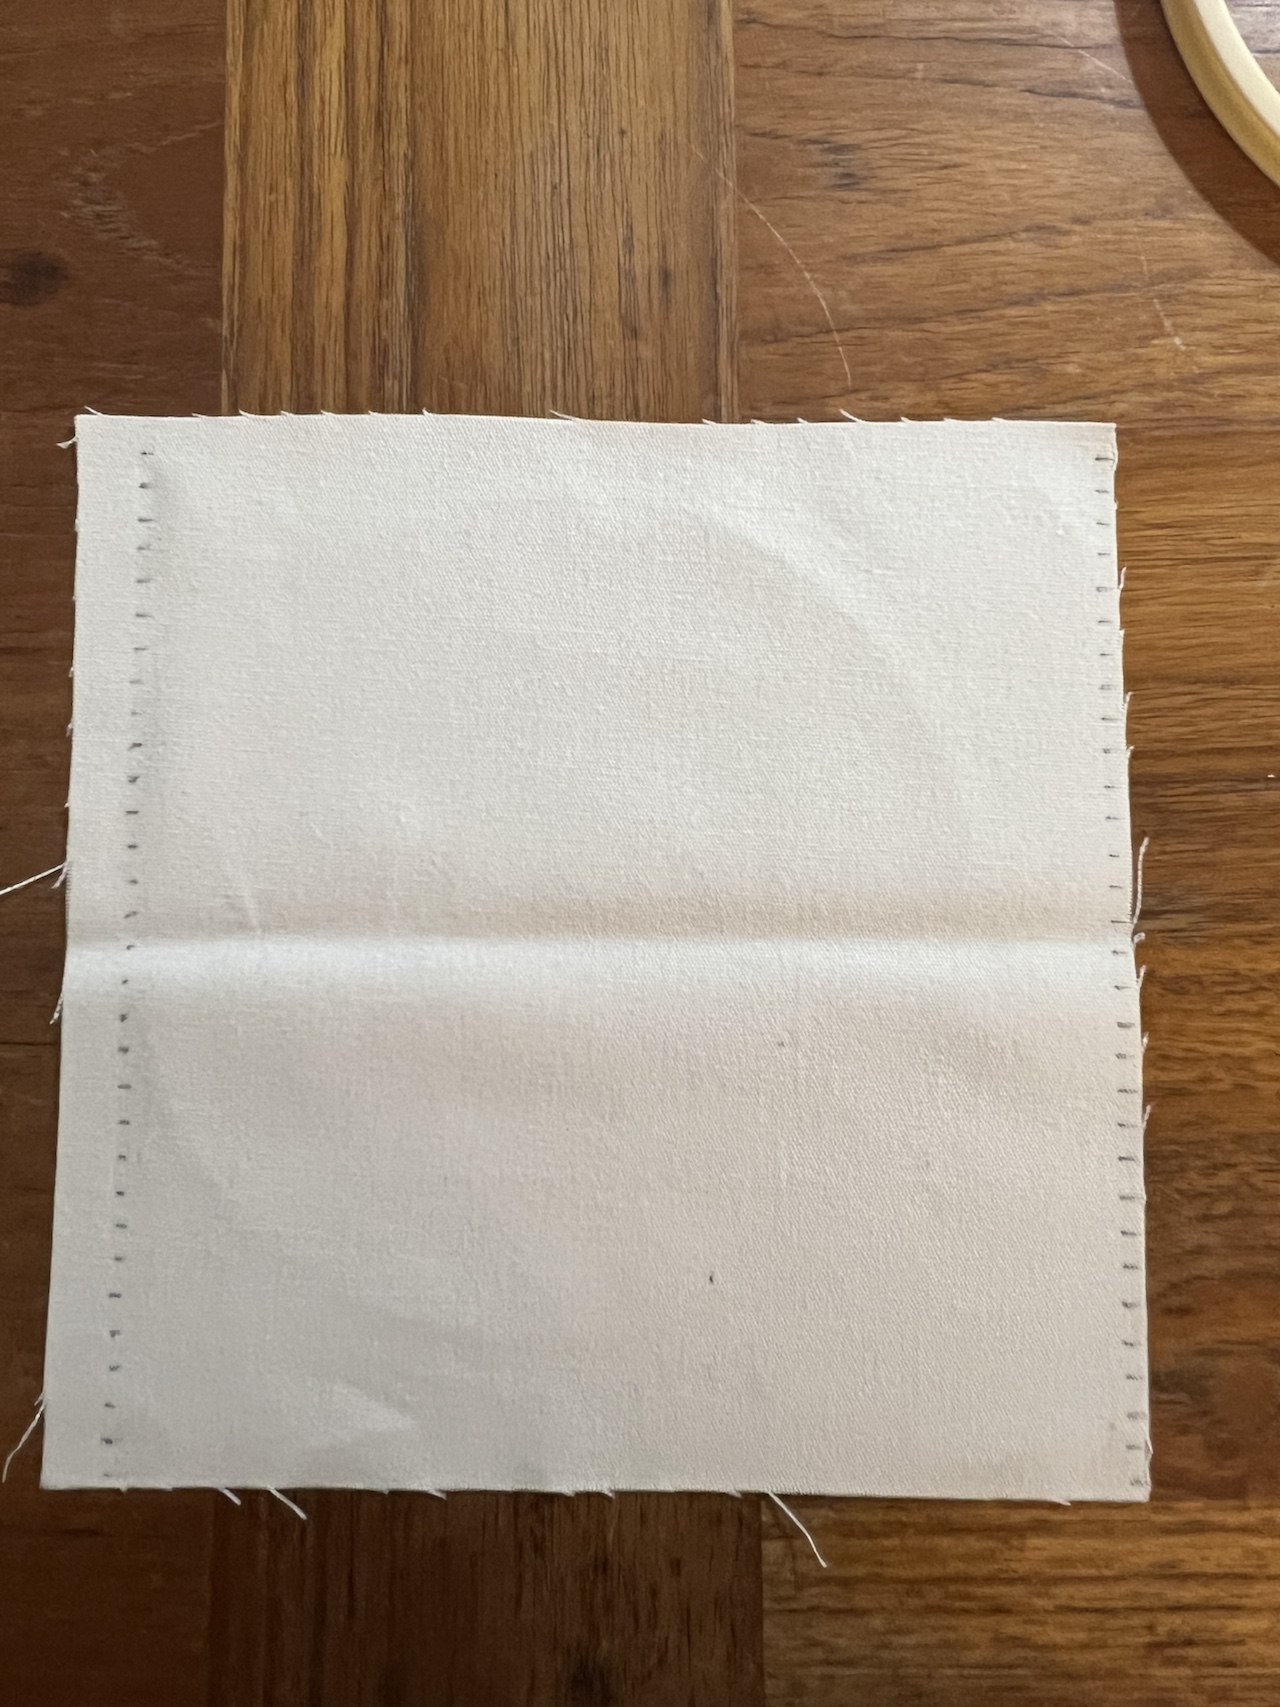
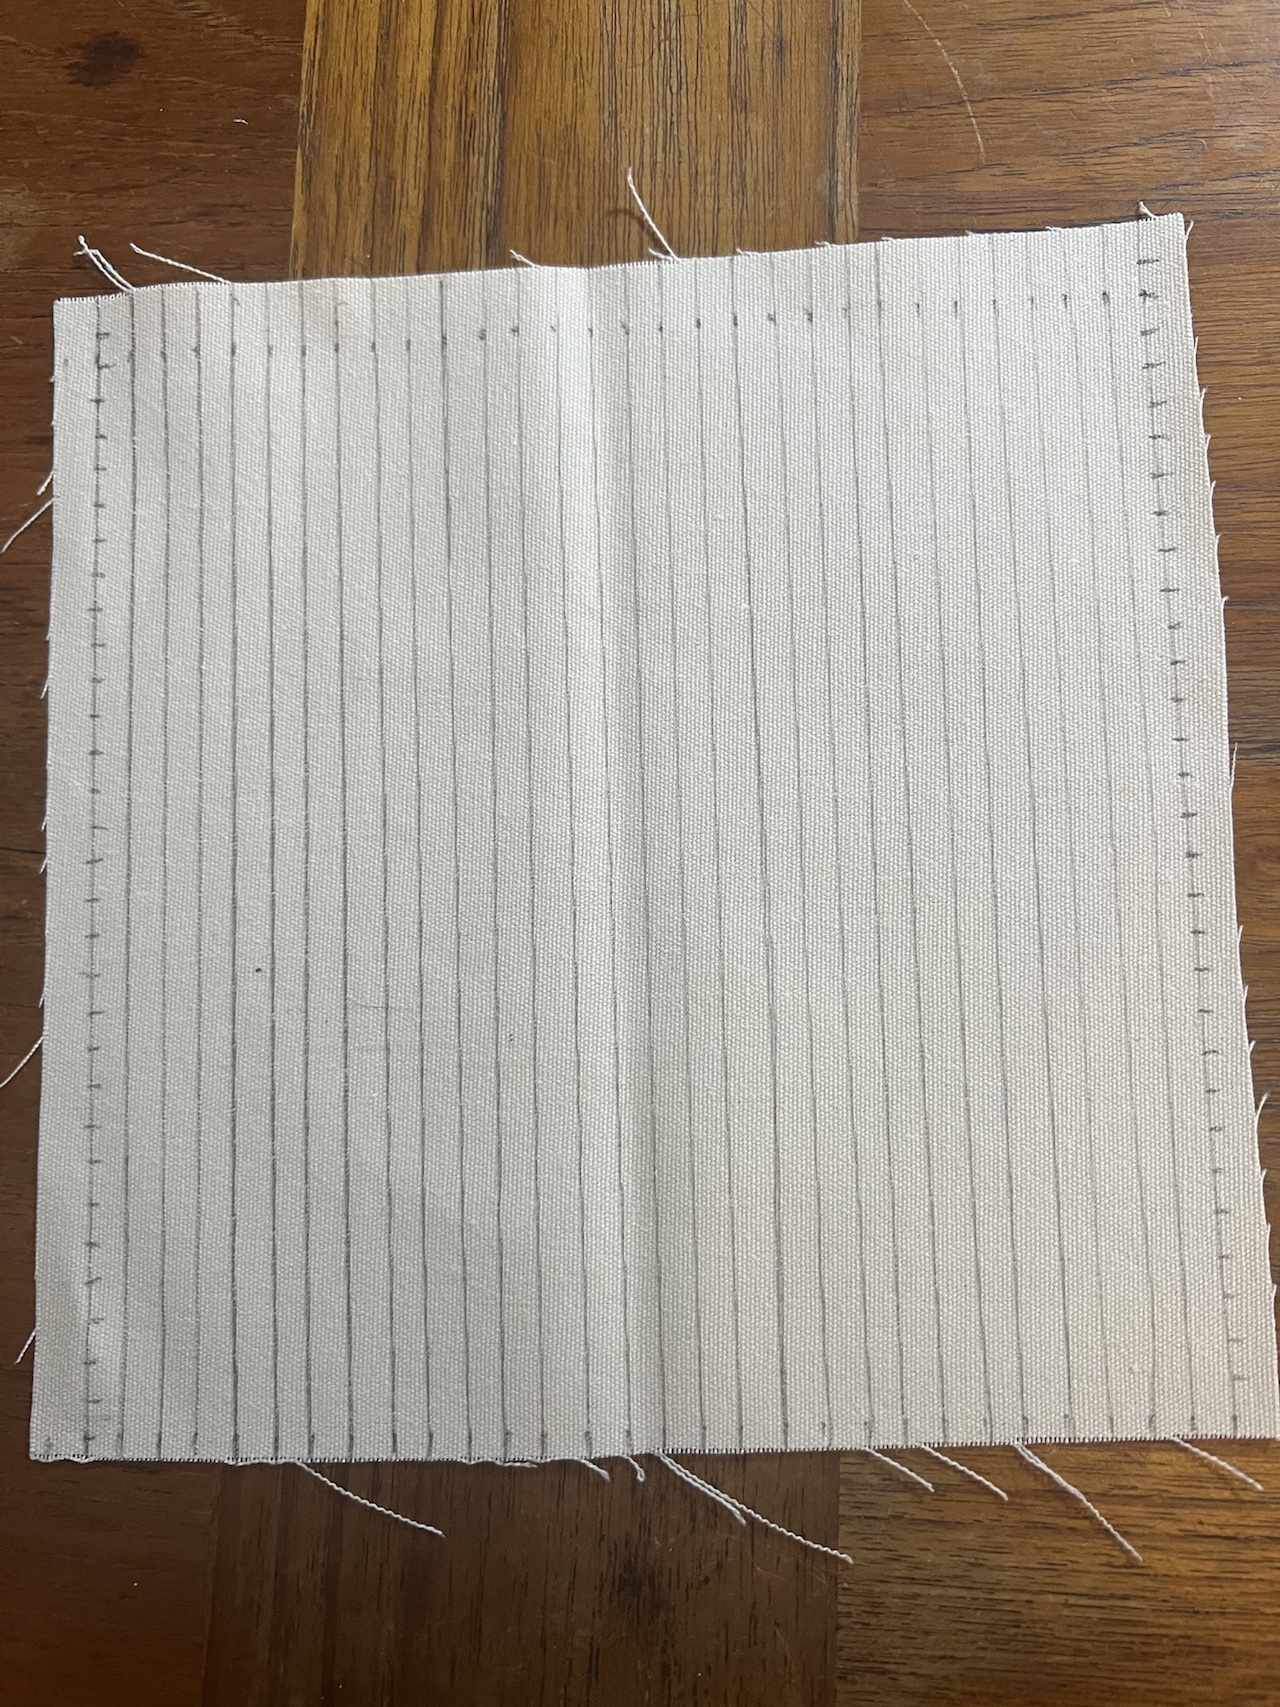
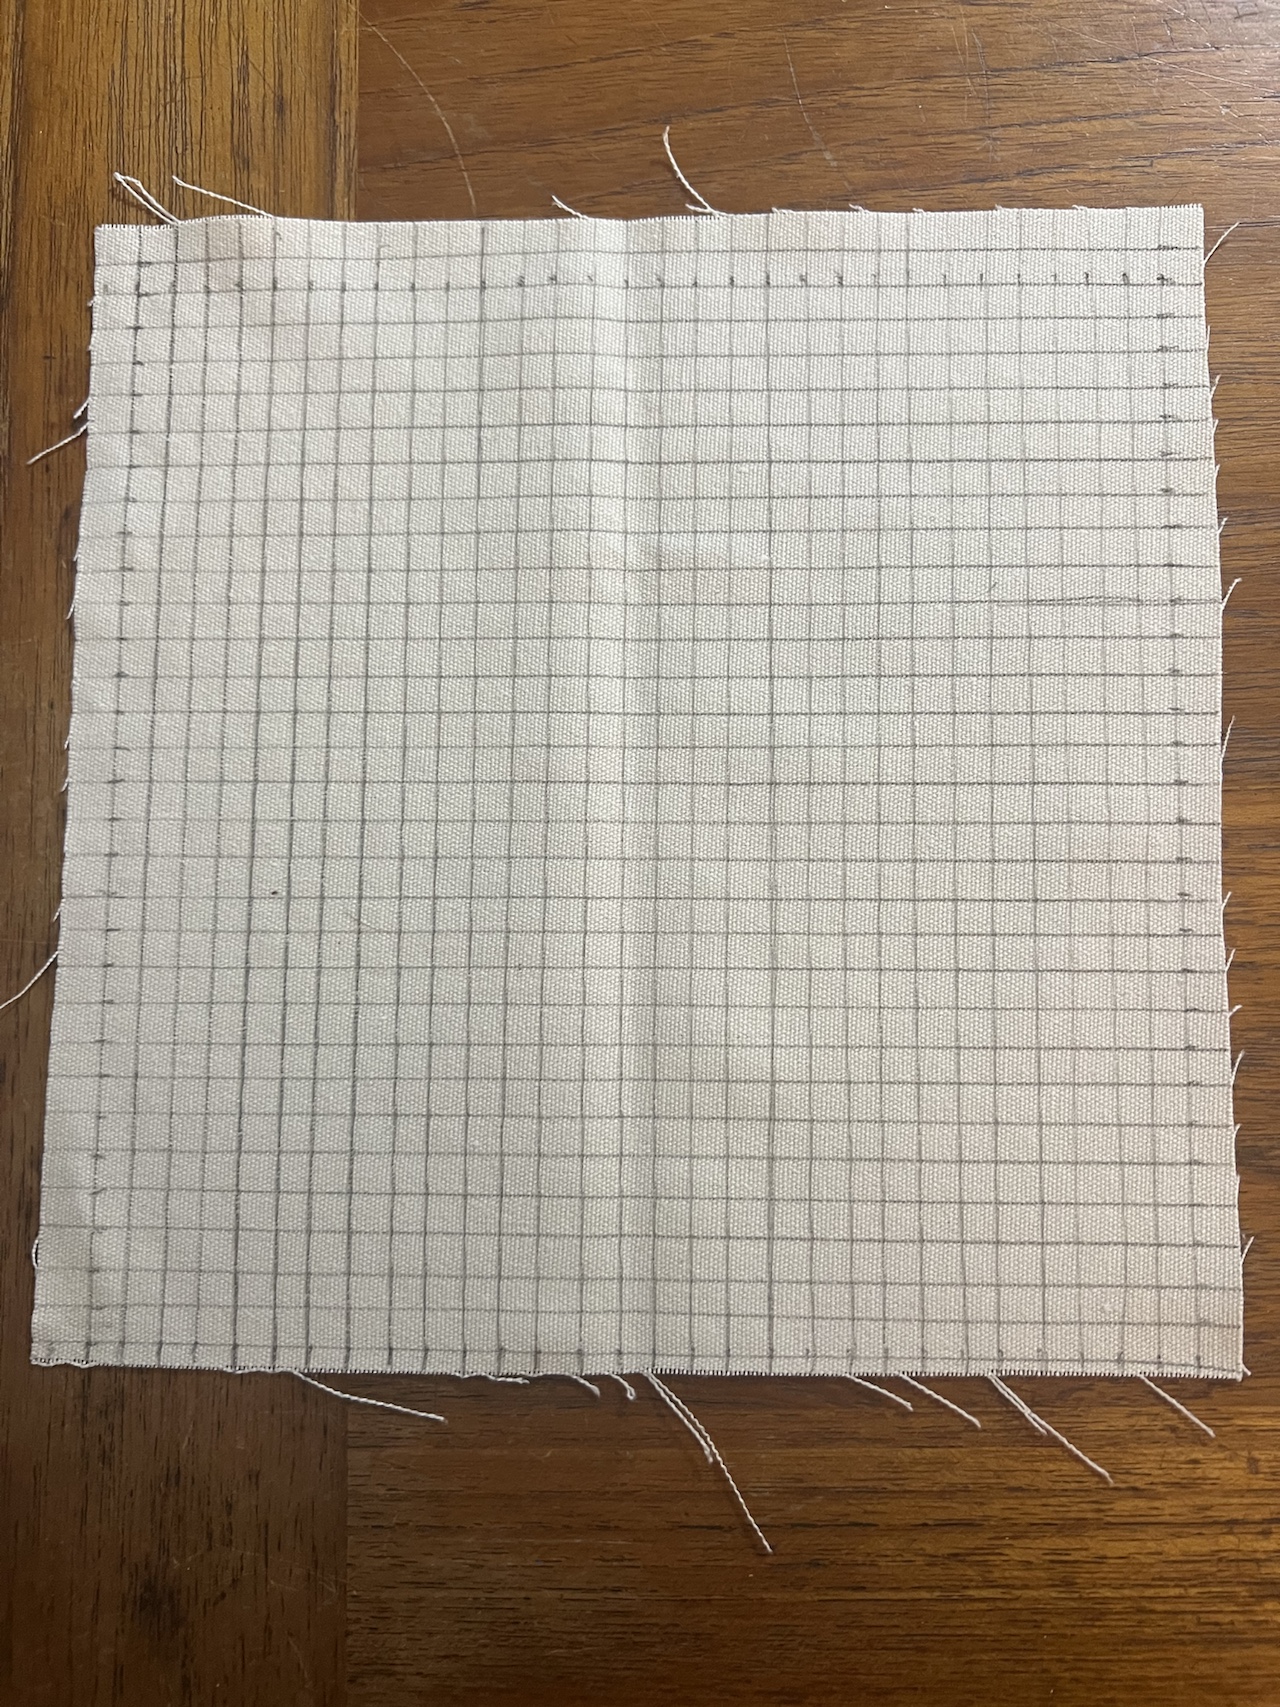
I made 16 horizontal lines, and 16 vertical lines, on my linen — just using a ruler and pencil.
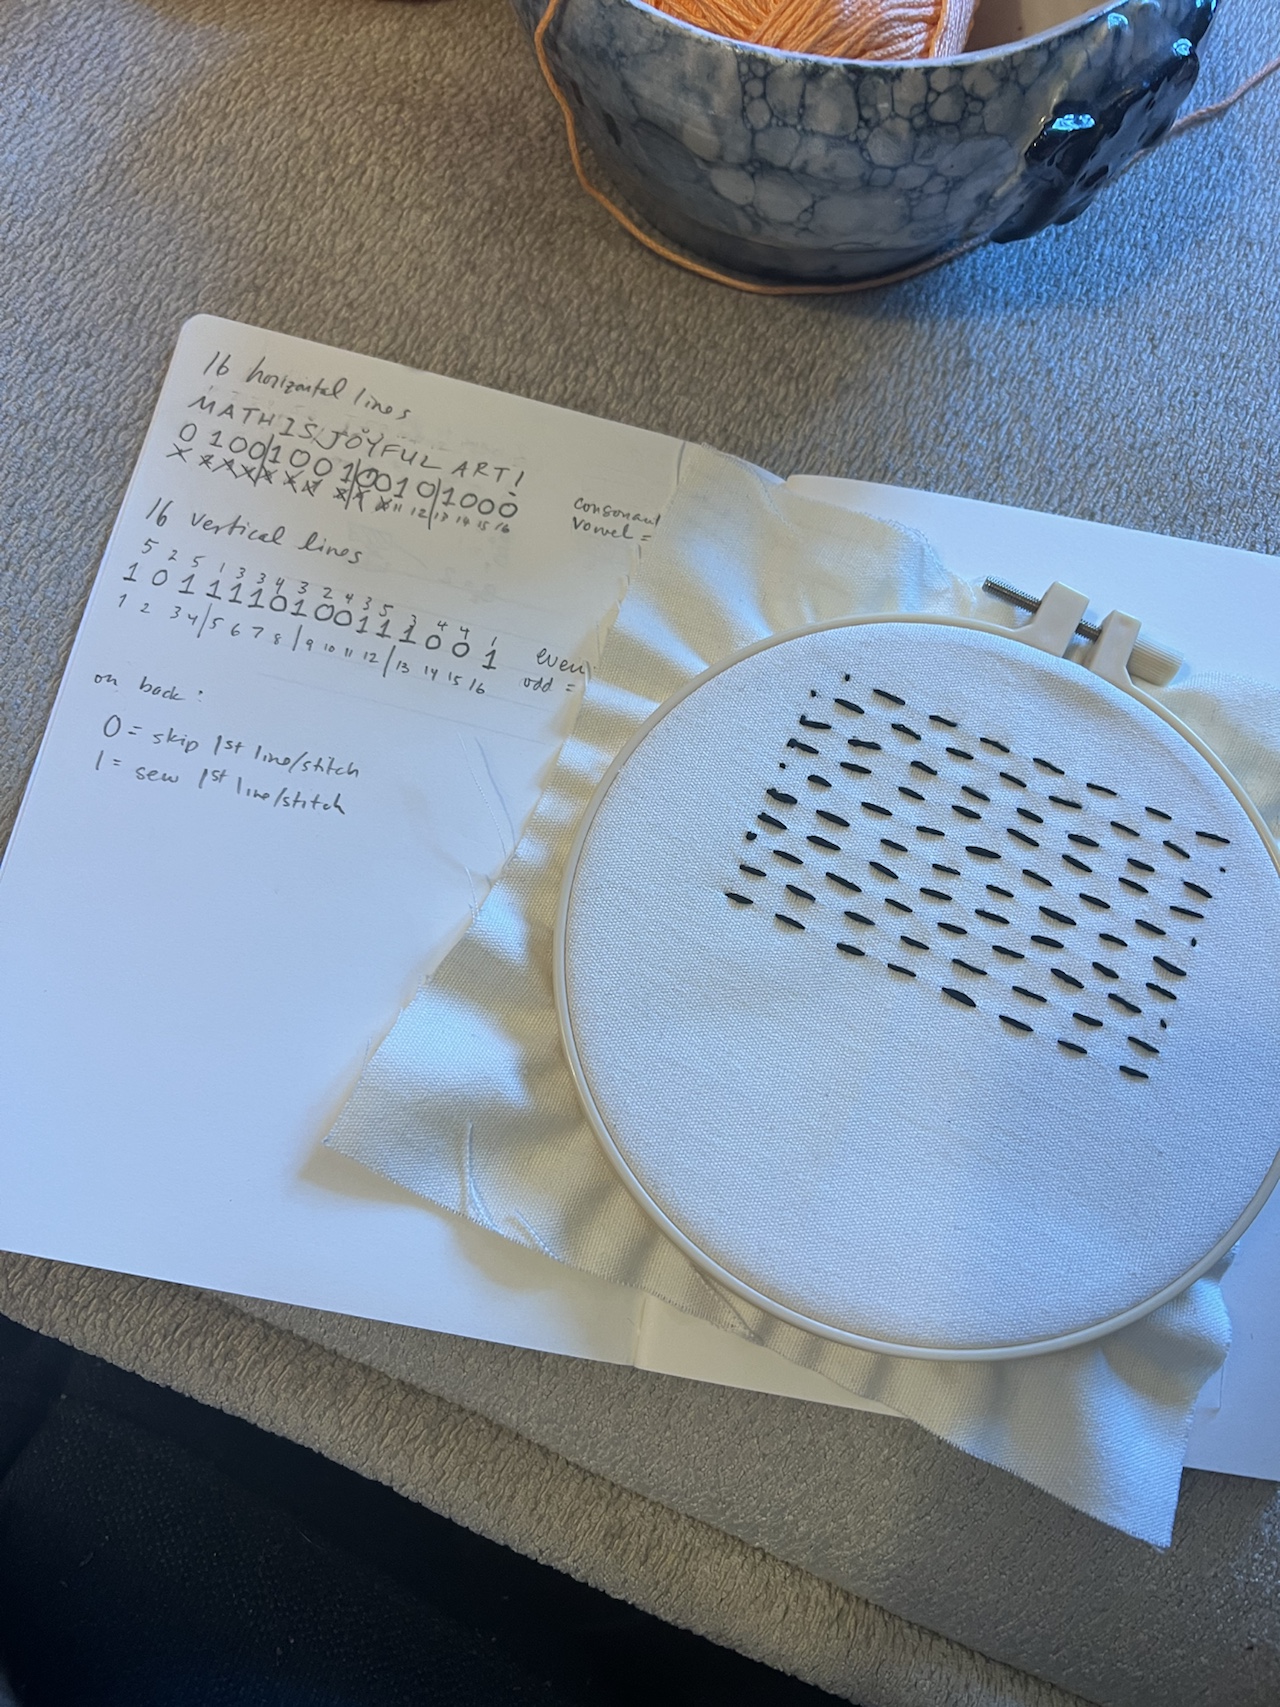
To decide the way I would stitch the horizontal lines, I chose to do what Ayilean did in her Numberphile video and encode a phrase: MATHISJOYFULART! 0100100100101000 [every consonent is a 0, every vowel is a 1]
And then I had to sew! I was basically figuring this out on the fly. How to tie knots, how to end a row of stitches, how to efficiently thread the needle, how to avoid knots. And I knew I wanted the back of the embroidering to look nice too!
And then we get to the end! The final product!
Clearly I’m not amazing at making my stitches yet. And I think I might want to use a thicker floss or even some cotton yarn next time. I saw some patterns made with light string on dark cloth, and I think those looked beuatiful too. But I’m really proud of how I just decided “hey, can I do this? I think I can!” and just made it happen!
From thinking about quilts to Truchet tiles to hitomezashi, my mathematical life today was very full.
A Hitomezashi generator where you can enter binary strings: https://www.forresto.com/sashiko [I like this because then you can see what the front and back are by changing the strings to their dual]
A friend found this Sangaku, which if you don’t know (from Wikipedia) are Japanese geometrical problems or theorems on wooden tablets which were placed as offerings at Shinto shrines or Buddhist temples during the Edo period by members of all social classes.
The question that I’m attempting to figure out is: what is the radius of the small circle in relation to the length of the side of the square? And you’ll see from the text she sent me, there is the answer.
We found the puzzle curious and we thought the figure was lovely, so we decided to make a piece of stained glass math-art for it. (We’re trying to teach ourselves how to make math-based stained glass art. As you can see from the picture below, we’re still very much novices!)
I spent over an hour on the problem this morning. I played on Geogebra to get the contours of the problem itself to help me understand the constraints. And then since I didn’t have a better approach, I started brute forcing it. I came up with equations when I put everything on the coordinate plane (using calculus to find slopes!), found some tangent lines, and looked for intersection points of these lines. I knew it wasn’t efficient, but I thought it would at least help me see how things would shake out I was hoping lots of terms would drop away…
Alas! The algebra got messy, and then I thought I’d have a system of equations that could be solved.
To be frank, I’m pretty sure in the mess of algebra, these equations are probably not correct. And I couldn’t really solve them anyway. (If you’re wondering what a, b, and c are, they stand in for slopes of the three lines (pink, light blue, green).
I’m officially annoyed and ready to give up. At least for now, or for a few days, or maybe forever. BUT the reason I’m posting this is that I’d really love a solution. Why is the radius of the circle 4/33s (where s is the side length of the square)? What is the approach to figuring this out?
UPDATE: I posted about this online and here are some of the assists I’ve gotten. I was going to look at them today but I’m not feeling super well.
From Facebook: Bowen: “Check out Descartes’ Circle Theorem…” [here] From Jason: “I am sitting across from Bowen this morning and UNBEKNOWNST TO ME, you sniped us both in parallel. Unbelievable. I solved it on paper, got all excited, and then saw that Bowen– SITTING ACROSS FROM ME– has already supplies that link above. Anyway, I’m not going to let him Liebniz my Newton here. I did some work on paper independent of him and will publish it with pictures in the comments below.
I mean, I did not write the work in a way that was designed for other people to write, so there are a LOT of “S” letters that might either stand for “the numerical length of the side” or “the name of the solution circle”, depending on context.”
From BlueSky:
From diffgeom: If we invert the plane ((r,θ) -> (1/r,θ)) about the point where the three large circles meet, each maps to a coordinate line; the small circle maps to a circle whose center and radius look easy to find, and inverting again should give the radius? Will give this a try…
I replied: Omg- my brain!!! Wow! I don’t know if I’ve ever inverted the plane and I didn’t even think to look at this problem through polar. I’m so intrigued!!! Essentially you’re saying the diagram will look easier once we do the inversion, we find the answer in the inverted world, then put it back?
[At this point, I looked up and watched this amazing 27-minute Numberphile video that explains some of the basics of inversion and got me excited: https://www.youtube.com/watch?v=sG_6nlMZ8f4]
tcorica replied: So, I’ve captured everything in a Desmos sheet EXCEPT how to take the final circle and un-invert it to find the uninverted center and radius. Any hints? I’m avoiding “reading up” on inversion, but I will if needed!
P.S. I flipped the image across the horizontal so that the given circles had centered on an axis, making it easier to write the polar equations in terms of r. @samjshah.bsky.social
tcorica also shared: I saw the responses suggesting “inversion” – i.e. recasting the problem by writing equations r= and then rewriting them as r’=1/r=. I’ve still managed to avoid looking inversion up 🙂, but I’ve done some thinking and experimenting with it – it’s a surprising and cool technique. I’ve found a reasonably nice solution to this using inversion. Because the answer is a weird looking fraction, I’m wondering if perhaps there actually isn’t a pretty geometric solution to this pretty problem! As an introductory exercise, I found it useful to consider the problem of finding the intersection of the circle with radius P and center at (P,0) with the circle of radius Q and center at (0,Q). E.g., show that the POI lies on y=(P/Q)x. Tons of approaches possible, inversion being one. 3/3
diffgeom replied: My approach: A circle of radius r at distance R from the center of inversion has points at distance R±r on a ray; inverting in the unit circle gives points at distance 1/(R±r), so the radius is (1/2)(1/(R-r)-1/(R+r)), or r/(R^2-r^2). (IIRC, the distance to the center is half the sum, R/(R^2-r^2).)
nsato7 also commented after diffgeom:
As @diffgeom.bsky.social points out, inversion takes care of the problem nicely. (And many of these Sangaku problems were solved by inversion.)
The three arcs invert to three lines. There are two circles that are tangent to these three lines; we want the “top” one.
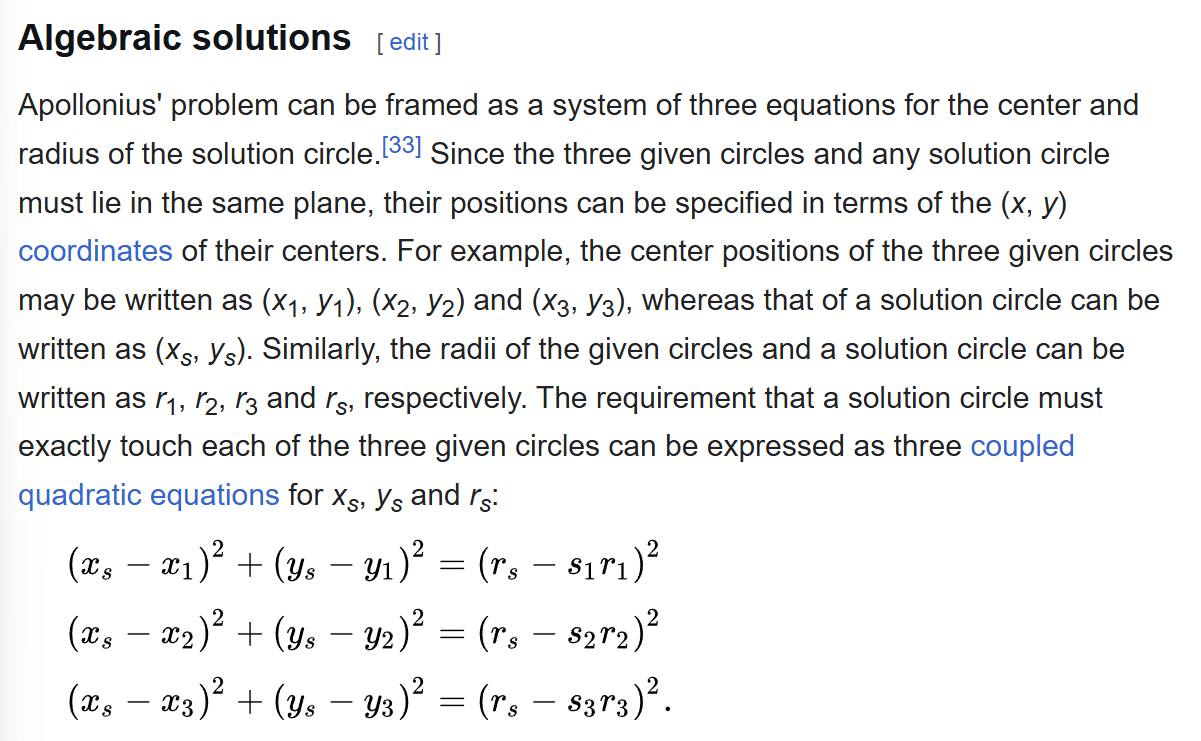
mqb2766 shared: Similar to the other posts, a modern version of this problem is gps/trilateration with the distances from the known centers being 2-r and 1+/-r so 3 quadratics in 3 unknowns – the center and the radius. You get a trivial solution of r=0 as well as the stated one.
noswald also shared (unrelated to the others): My inelegant solution would be to impose a coordinate system on the figure and set up three equations involving the coordinates of the inscribed circle and its radius. We know the distance from the center of the circle to a corner is s-r, to one side’s midpoint is s/2-r, and to another side is s/2+r
From Email
My friend Japheth W sent me his written work, which he said I could archive here, noting “It’s not quite publication ready, but probably understandable to math teachers who are experts at reading even more disorganized student work.”
I did a 4-week math teacher professional development this summer: 21st Century Math 2025. I participated in it also in 2023, its first year, and really loved it. I highly recommend it for math teachers who love math, but haven’t played around with math puzzles or exploring novel mathematics themselves in a while. As Fawn Nguyen put it in our closing session (she was a featured speaker), she said this kind of work “nourishes us” as teachers. I truly felt that and loved that description.
It is a “choose your own adventure” model where we have lots of options of how to engage. I focused my attention on working on the problem sets and attending zooms from various research mathematicians who were talking on their research related to the problem sets. Because of my summer schedule this year, I didn’t dedicate myself in the same structured way that I did in 2023 when I felt like I mined a lot of the content. Here, I did some deep dives into much (but not close to nearly all) of the content, and I wasn’t able to make all the zooms or create/give an end-of-program presentation. Still I feel like I got a lot out of it.
Participants communicated on a Zulip site (like a discord server). I wanted to archive some of the links that participants shared on that site, since it will force me to go through everything posted, and also collect all the links I think might be helpful in the future where I can access them all in one place. It’s a bit of a hodgepodge of things.
Articles/Books and Interesting Problems:
One participant posted: “I’m interested in making ways for people outside universities to engage with current maths research (recently I put together this puzzle x article that folks here might be into!)” [and here are all of their science/technology articles]
Someone asked for a good book to teach themselves some number theory, and someone else responded with the book written by a math tiktok-er I like! It’s free online, which is awesome, called “Number Theory and Geometry.” A quick skim makes it feel accessible, which doesn’t surprise me from their tiktoks! Another highly recommended “An Illustrated Theory of Numbers” which isn’t free, but the preview looks really lovely and up my alley since I love concrete and visual learning.
One interesting problem that was shared was the Sword of Knowledge: “A sword of knowledge can slay the Dragon of Ignorance, who has three heads and three tails. With one stroke, slayers can chop off one head, two heads, one tail, or two tails; however, the consequences lead to a variant of the structure. In order to successively slay the Dragon of Ignorance, Students must exercise strategic analysis when fighting this creature.” And what’s really lovely is that the website has a lot of great “math fair problems” which seem like fun, rich, and investigative problem solving tasks.
The PD organizer also shared: “Here are a couple of short videos related to this thread; they recently popped up in my social media. They are clips of interviews with two Oxford undergraduates studying maths. I particularly like what Ellie says in Part 2 about “You realize that you’re right for being confused, and that anybody at any stage who acts as if they understand what’s going on with maths has no idea what’s going on.” Sometimes it’s our students who are trying to actually understand what’s going on are the ones we think are “struggling”.
Another participant is heavily involved with the Julia Robinson Mathematics Festival (JRMF). They shared about two online math teacher community that grew out of this world they are involved in: “JRMF Community Math Circle: After running math festivals all over the world, JRMF pivoted in March 2020 to offering a weekly online math circle. I joined as a volunteer for a couple of months and then as an employee for a year. Being part of a community of people with similar interests all over the world was a silver lining to the pandemic for many of us. When JRMF went back to doing in-person events, some of us volunteered to keep the math circle going as a monthly event. We are always happy to have more volunteers. The math circle meets on weekends at 11 am PT, and for the two weeks prior to each math circle, we hold 90-minute trainings – exploring the topic and discussing pedagogy for it. You are welcome to come to observe a math circle and/or come to a training to find out about it. Even if you join as a volunteer, there is no obligation to volunteer any particular month – you just sign up for when you can. We are currently on a 2-month summer break but will resume in September. Puzzles & Pedagogy: The other is a weekly event that is kind of like a math circle for adults. It’s called Puzzles & Pedagogy and is run by Gord Hamilton of Math Pickle. Topics vary in level and the balance between puzzling ourselves and discussing pedagogy also varies. It meets weekly on Thursdays 12:30–2:00 PT and is also free and no-obligation. Both Math Pickle (MathPickle.com) and JRMF (JRMF.org) are also great resources for teaching – at any level!”
In response to that, another participant shared that they found an online Math Teacher circle, CAMI (Community of Adult Math Instructors). I’ve always wanted to participate in a math circle, so I’m hoping to join one of them! Here’s a flyer they link to, with a bit of information.
LaTeX:
For using LaTeX in MS Word, here’s a 1 minute video on how to do that. And here’s a comprehensive beginner’s resource for LaTeX and a place where you can draw a symbol and it spits out the LaTeX code for that symbol.
The PD organizer also gave these resources: “Overleaf is an online platform for writing documents in LaTeX. It’s like Google docs but for LaTeX. It also has a lot of document templates, very handy. It’s free for individuals, but there’s a subscription fee if you want to collaborate with others. https://www.overleaf.com/
In actual Google docs, you can go to Extensions and the Add-ons and install something called Auto-Latex Equations. This will let you type LaTeX formulas within your Google doc.
If you just need a snippet of LaTeX as an image, there are a number of website that can help you out. Here’s one: https://www.quicklatex.com/
Also worth knowing: if you have Keynote, LaTeX is a native feature! Just go to Insert and then Equation, type your LaTeX (no dollar signs required), and hit Insert, and you get a beautiful math expression that is scalable, etc.”
Soap Bubbles: These were one of the research focuses for the program
In one of the presentations, a researcher shared how he made the soap bubbles to illustrate his ideas: “To make these planar soap bubbles, you just need a shallow pan of some kind. I used the lid of one of these, because it’s what I had lying around. A baking sheet with raised edges, for example, should also be fine.
Then you need a sheet of acrylic. I got one from a picture frame. It needs to be big enough to balance on the raised edges of the shallow pan, so that it’s raised off the bottom a little (like, a cm or 2). Then you add water and dish soap to the pan, and use your hand to spread some on the underside of the acrylic. Put the acrylic on top of the pan and use a straw to blow bubbles in the gap between the pan and the acrylic. That’s it! If the bubbles pop when they hit the acrylic, spread more bubble mix on the underside.
I find that the bubbles are very visible in person, but they don’t show up well on cameras (or on zoom). If that’s what you need, adding a bit of food coloring to the bubble mix helps.”
Like in my last post, I want to share a math problem I was working on for a summer professional development I’m doing. This was part of the problem set that the PD organizer Justin Lanier wrote up. The problem is outlined here:
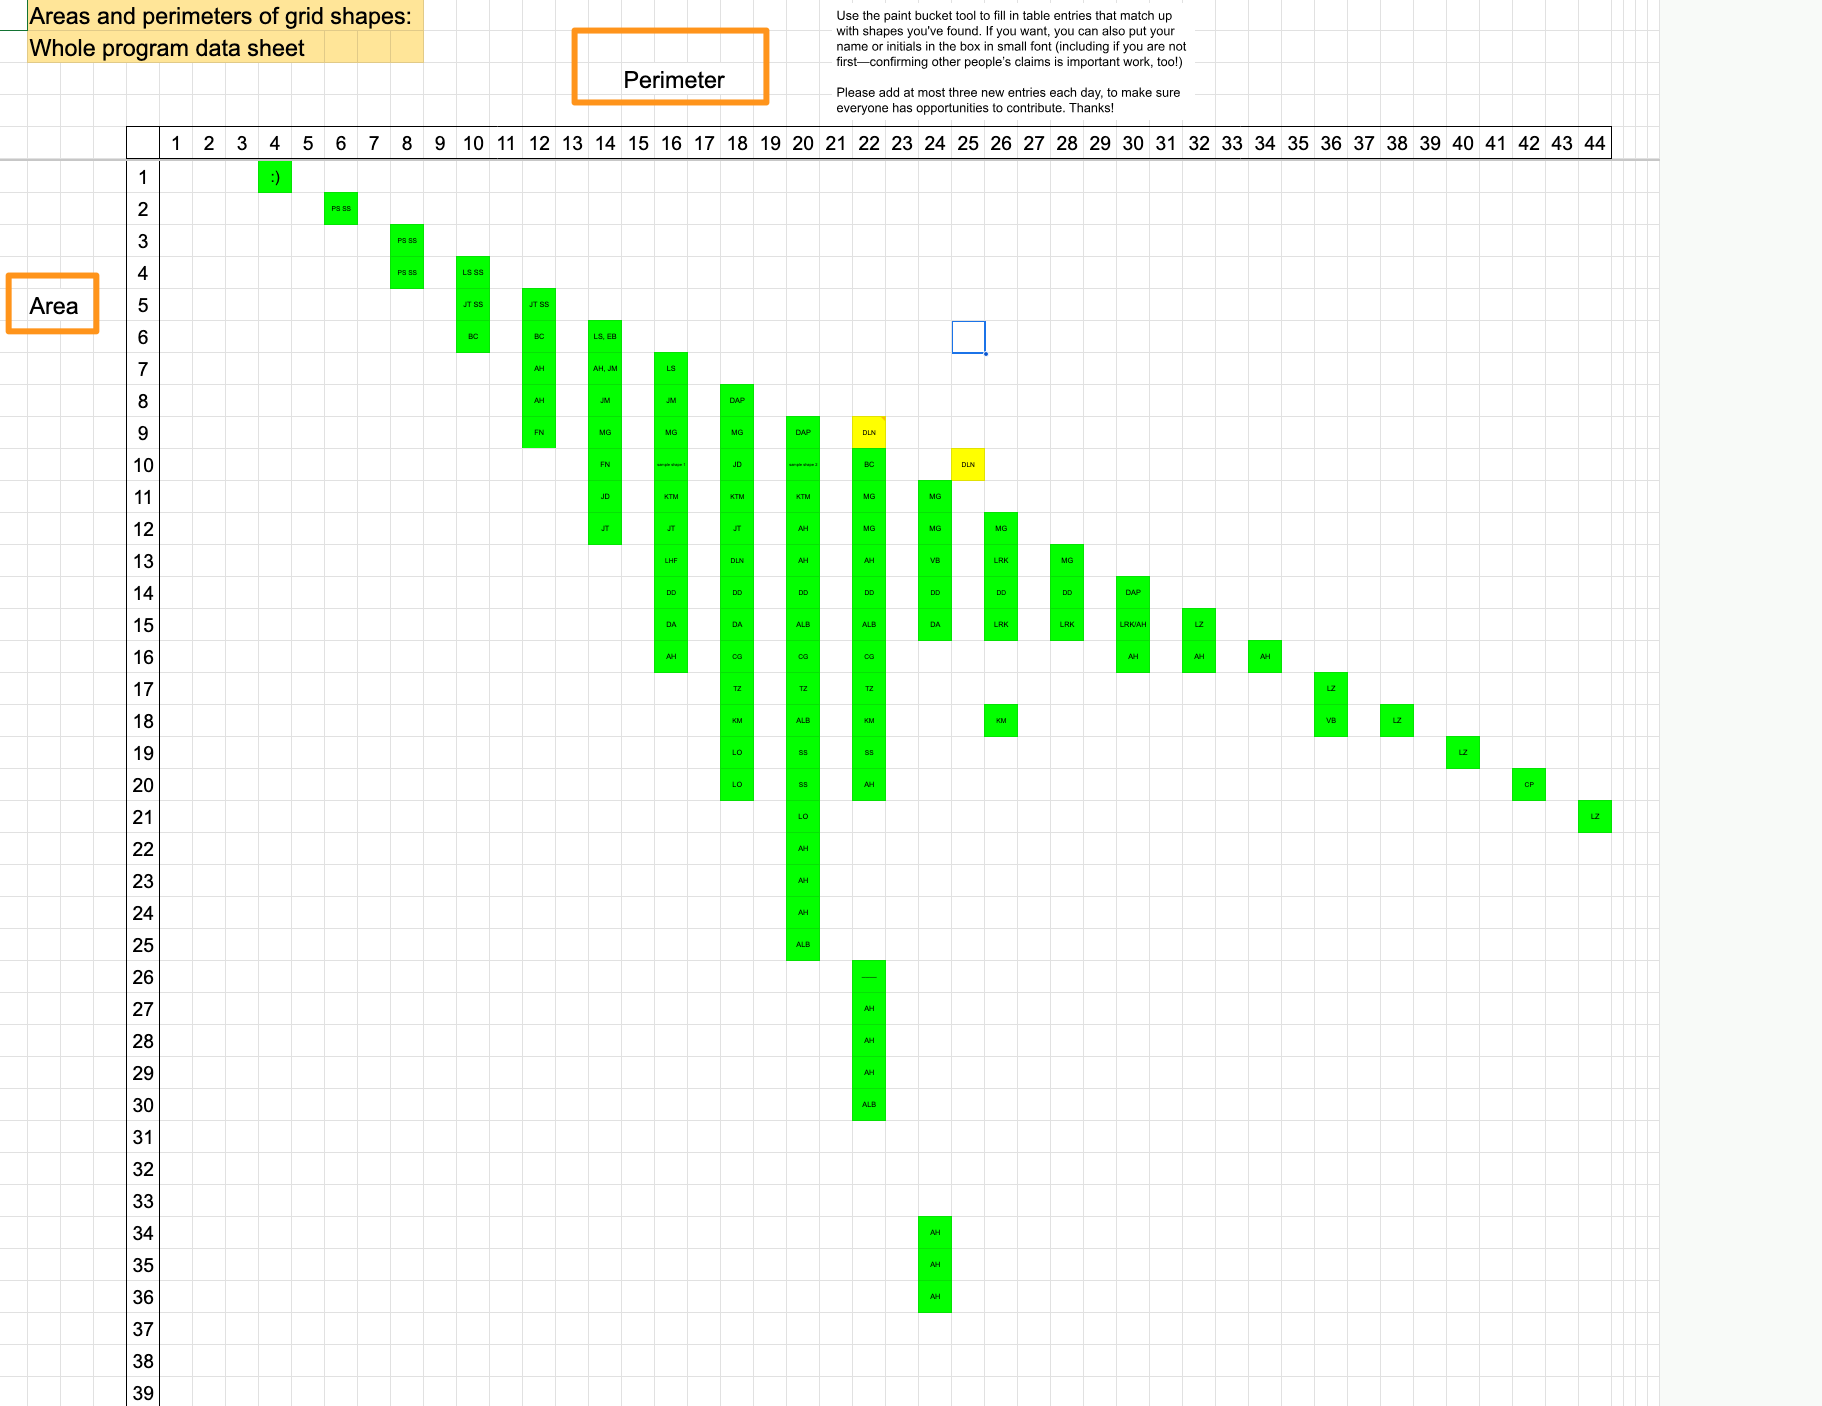
As part of this professional development, we started filling in a spreadsheet with various areas- perimeter combinations we could create. This is a screenshot of collaborative sheet we came up with:
I played around with this problem for hours and hours. I decided I wanted to focus on this question: If you have a given Area of n, what is the MaximumPerimeter you could get, and what is the MinimumPerimeter you could get?
I was relatively easily able to prove that for an Area of n, that the MaximumPerimeter you could create is 4+2(n-1). Here’s the argument in a nutshell. Each time you add on a new square to an existing figure, you either are adding 0 to the perimeter, 1 to the perimeter, or 2 to the perimeter. (This is easy to show.) So to get the MaxmimumPerimeter, you want to be adding the most to the perimeter each time. So if you start out with a single square (n=1) with a perimeter of 4, each time you add a square, you’re adding at most a perimeter of 2 to the figure. One easy way to create this figure is to just add squares like this:
This is where the 4+2(n-1) comes from. You start with a perimeter of 4, and add 2 every new square you add to it.
It took me a while to figure out the MinimumPerimeter. I am pretty certain I have it, but I’m still working on proving it in an airtight way.
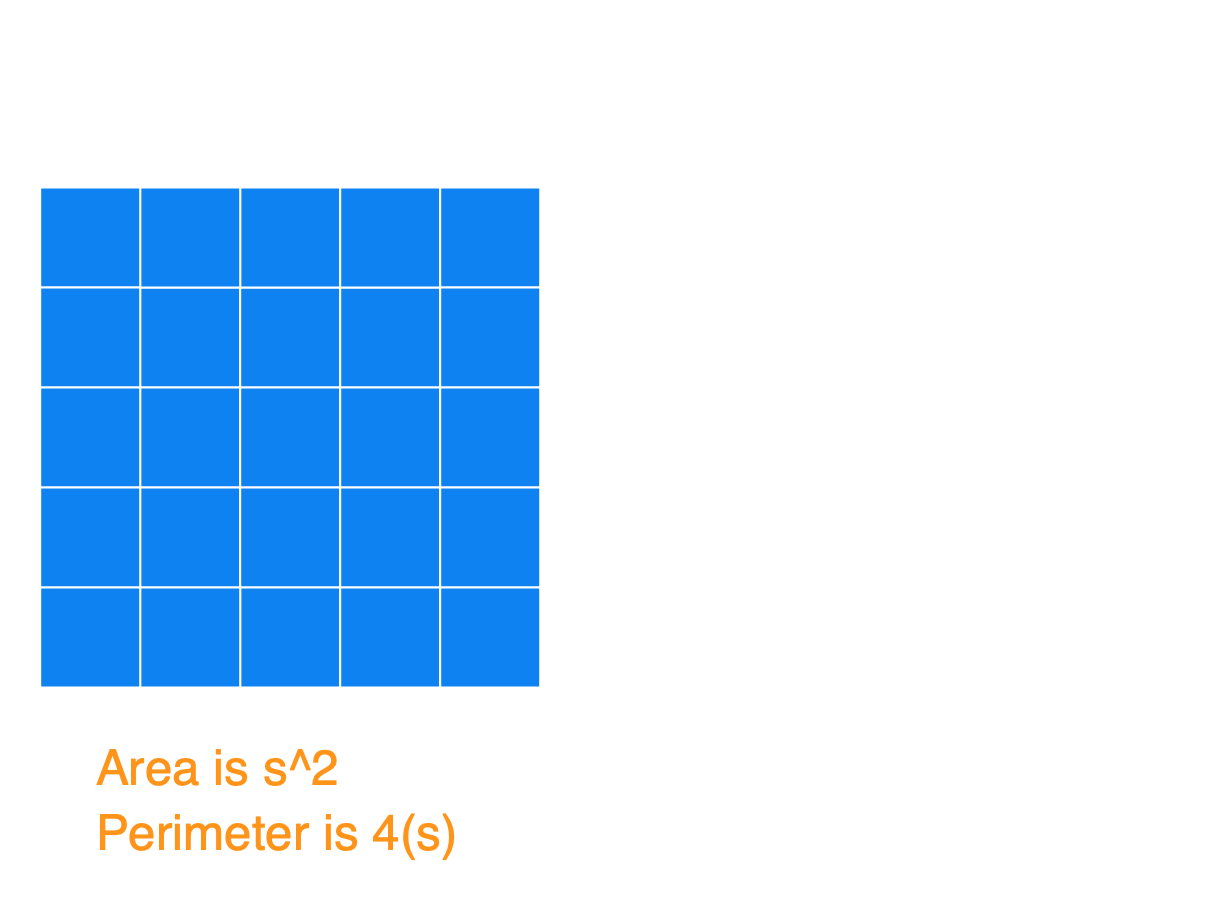
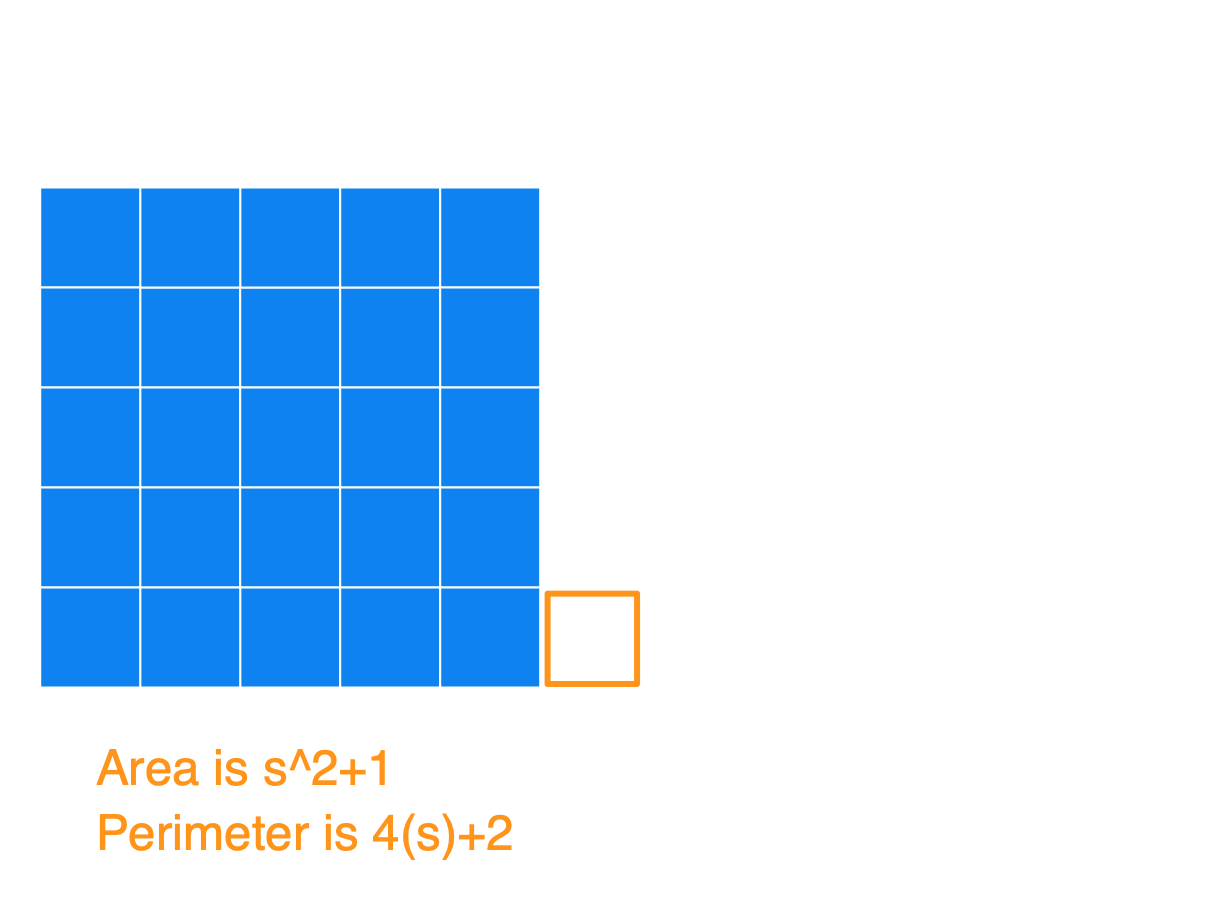
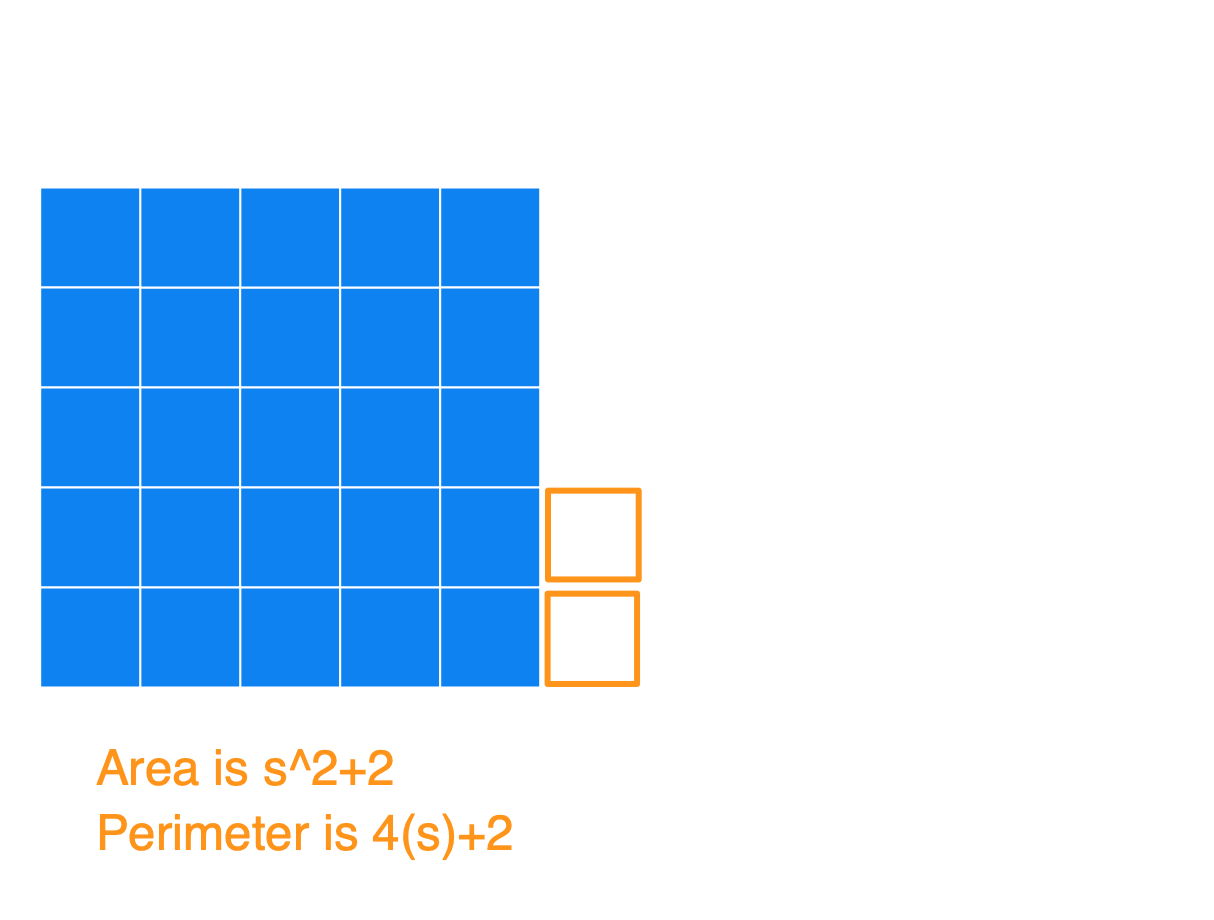
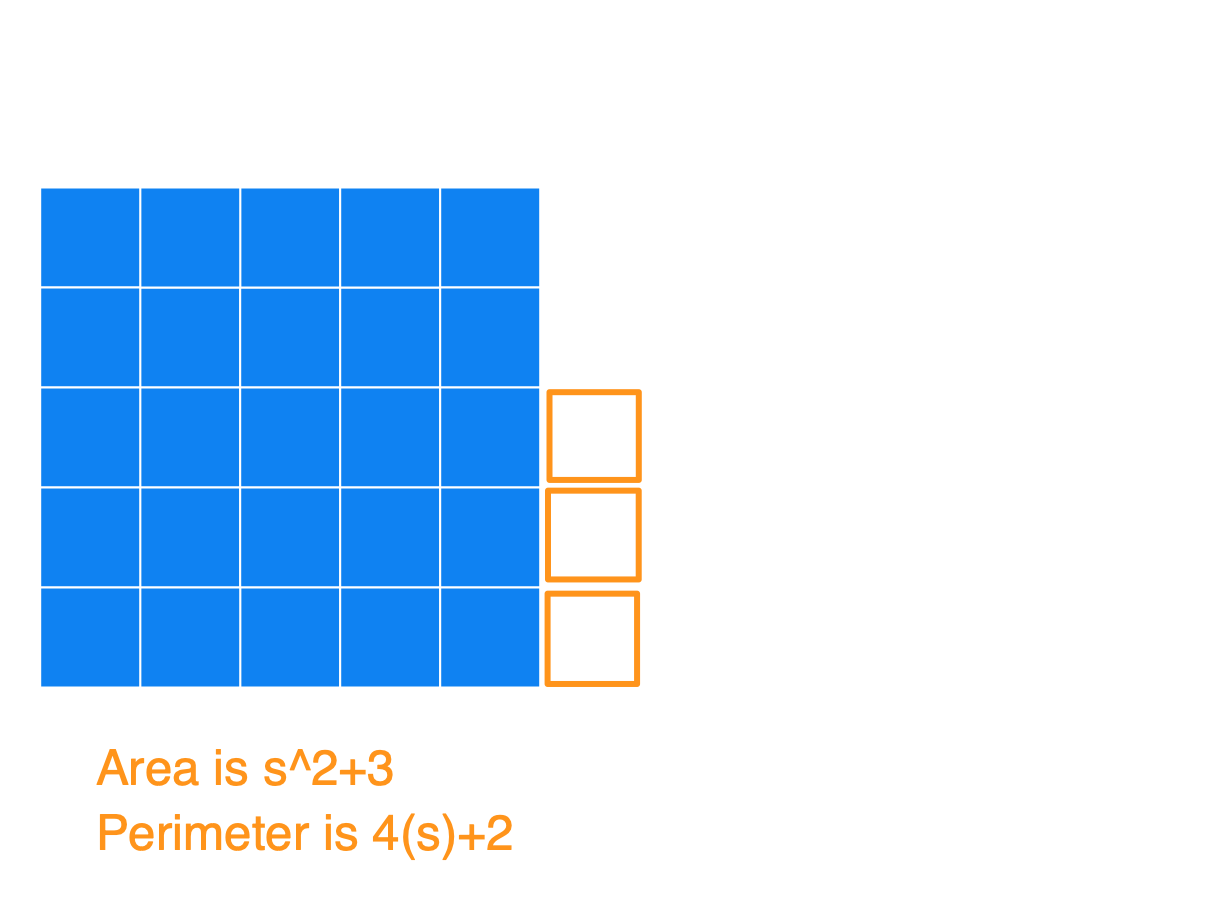
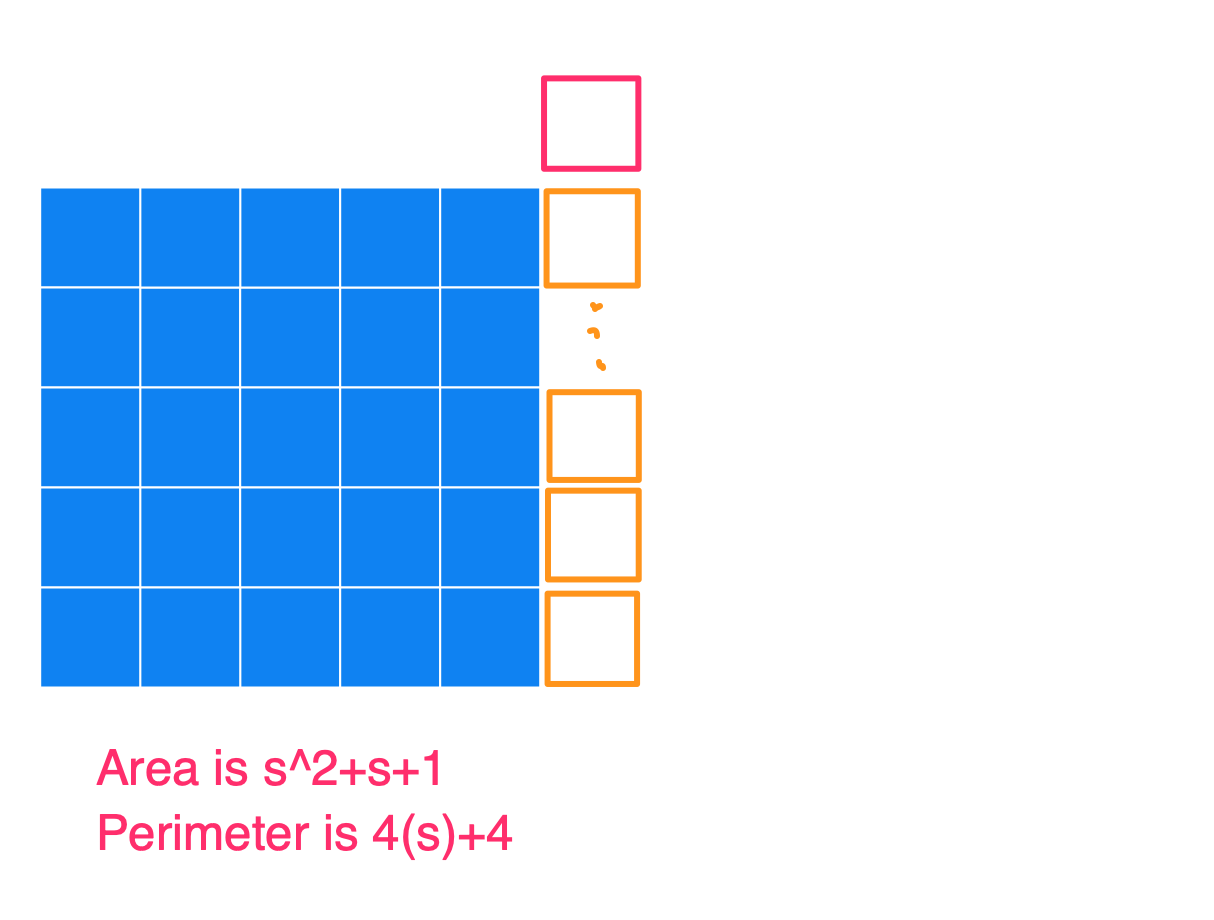
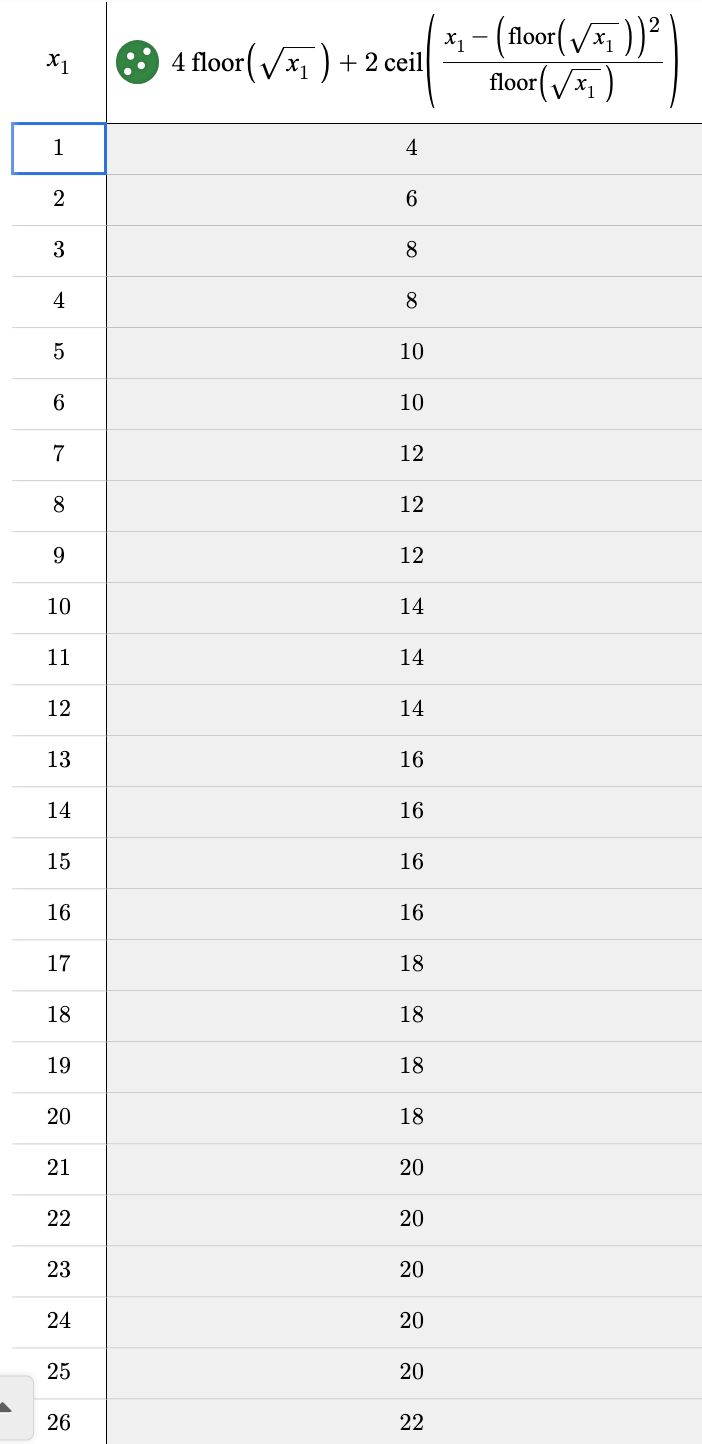
Basically, the way to construct the figure with a minimum perimeter is to create the largest square you can, and then append the remaining blocks to it. Below I have a series of images to show what the figures could look like for an Area of 25, 26, 27, …, 36, and also the Perimeters. I used s in the image (instead of 5) to show how this generalizes for any square number.
Some observations:
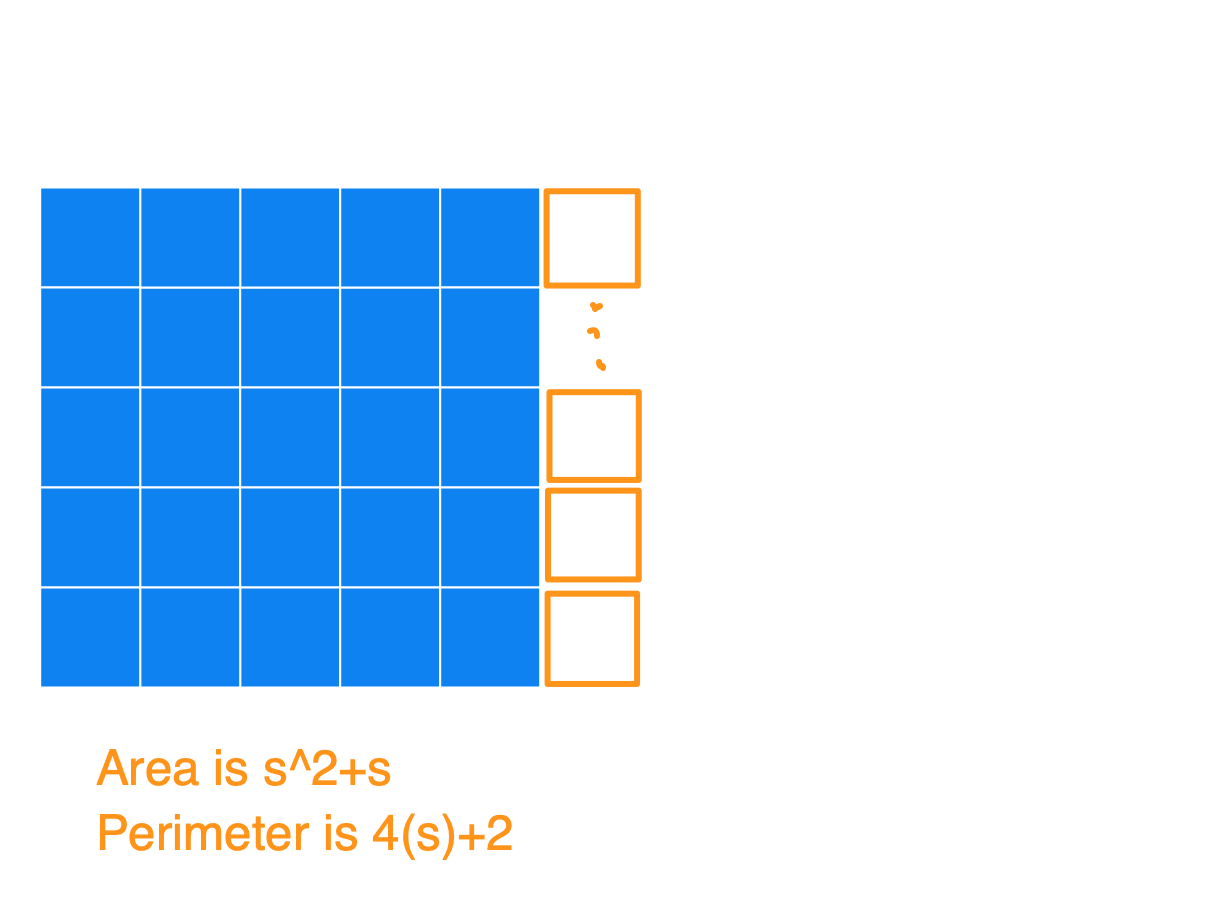
(1) Notice that after you start with that perfect blue square, each time you add a square (so for an area of s^2+[1, 2, 3, …, s]) you’ll always get the same perimeter of 4s+2. At this point, you’ll have an s by (s+1) rectangle.
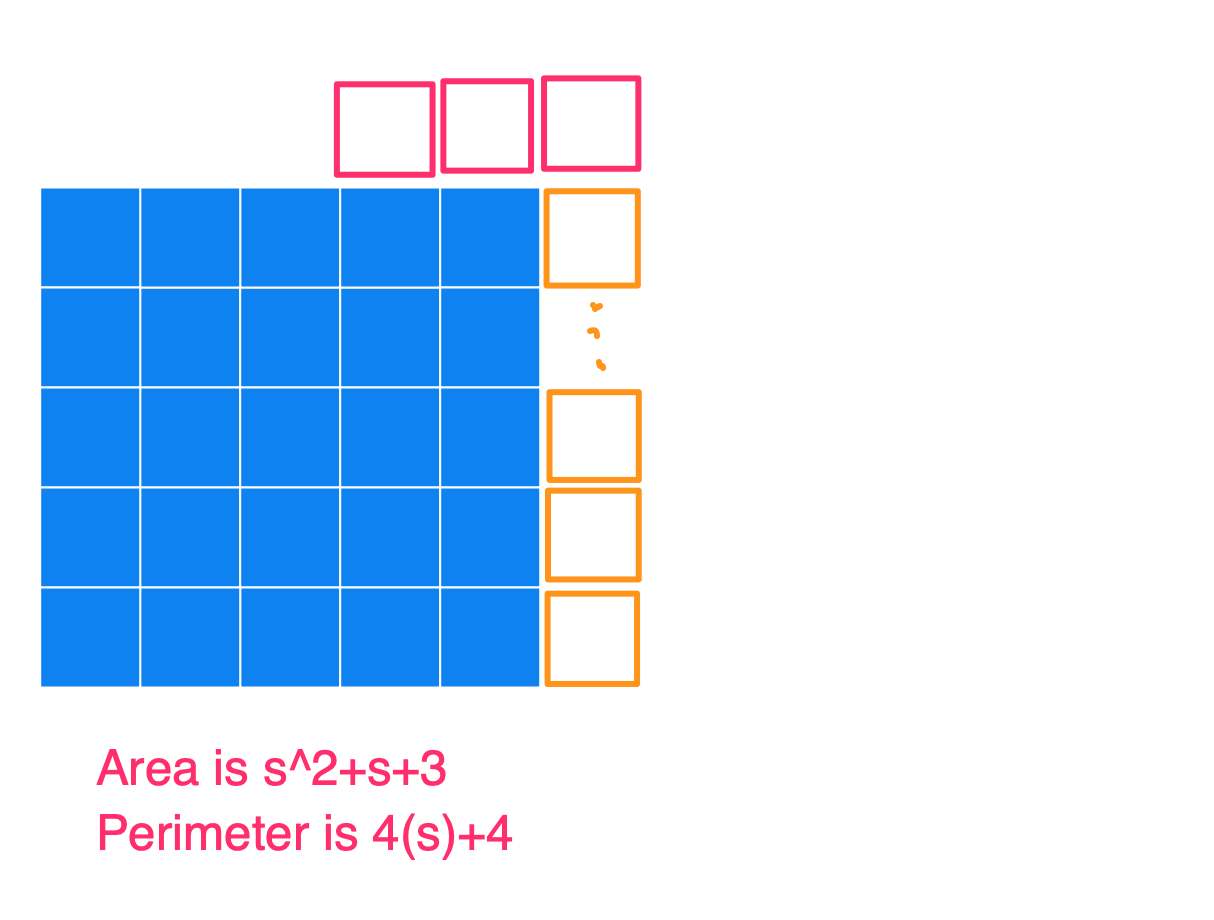
And then when you continue on adding more squares to this rectangle (so for an area of s^2+[(s+1), (s+2), (s+3), … (2s+1)]), you’ll always get the same perimeter of 4s+4.
(2) At the end, when you’ve finished this process, you’ll have a new area of s^2+2s+1, which simplifies to (s+1)^2. And the perimeter of this is 4 times the side length of the square, which is now s+1. So this makes sense as 4s+4.
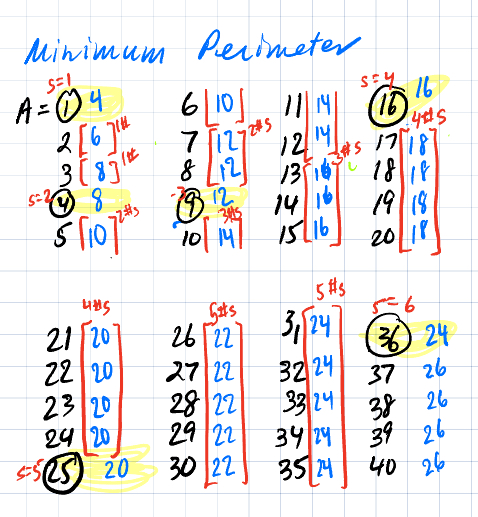
Here’s a chart I made which shows how the perimeter goes up after you hit perfect squares… Notice we know the perimeters of perfect squares, so for example at A=16 (a 4 by 4 square), the next four numbers will have a perimeter of 18 and the four numbers after that will have a perimeter of 20. That’s then when we hit the next perfect square of A=25.
So far, we have this:
Take your Area of n and find the largest perfect square the goes into it. Call that s. If the remainder is 0, then you have a minimum perimeter of 4s+0. If the remainder is 1, 2, 3, …, s, then you have a minimum perimeter of 4s+2.If the remainder is (s+1), (s+2), (s+3), …, (2s), then you have a minimum perimeter of 4s+4
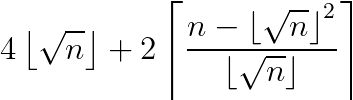
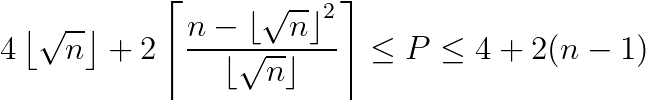
However I didn’t want a formula in terms of s. I wanted an explicit and closed formula in terms of n. I wanted a direct answer to the question: if you have an Area of n, what is the Minimum Perimeter in terms of n? And I got it…
It’s kind of ugly looking, but hopefully you can see the motivation. The first part is just 4s. The second part is the correction factor (of +0, +2, or +4). The numerator in the ceiling function calculates the remainder. When you look at the entire ceiling function*2, it will give you 0 when you have a reminder of 0. It will give you 2 when you have a reminder of 1, 2, 3, … , s. And it will give you 4 when you have a remainder of (s+1), (s+2), (s+3), …, (2s). I was pretty proud when I was able to use my table above to figure this out. I checked using Desmos to confirm!
At this point, I’m confident about these bounds for the Perimeter of a figure with Area n…
Now I’m stuck on the very last thing… I am confident with my formula for the Minimum Perimeter, but I haven’t proved it.
I think I have a way to show that if the Area is a perfect square (so n^2), then the Minimum Perimeter always occurs when the squares are arranged to form an n by n square. However at the moment I can’t seem to move forward from there.
This is going to be a writeup for a math problem I’ve been working on for a professional development thing I’m doing this summer. The question related to soap bubbles. Because I just want to get something up, for now I’m going to quickly say that the problem I’ve been tackling reduces to this:
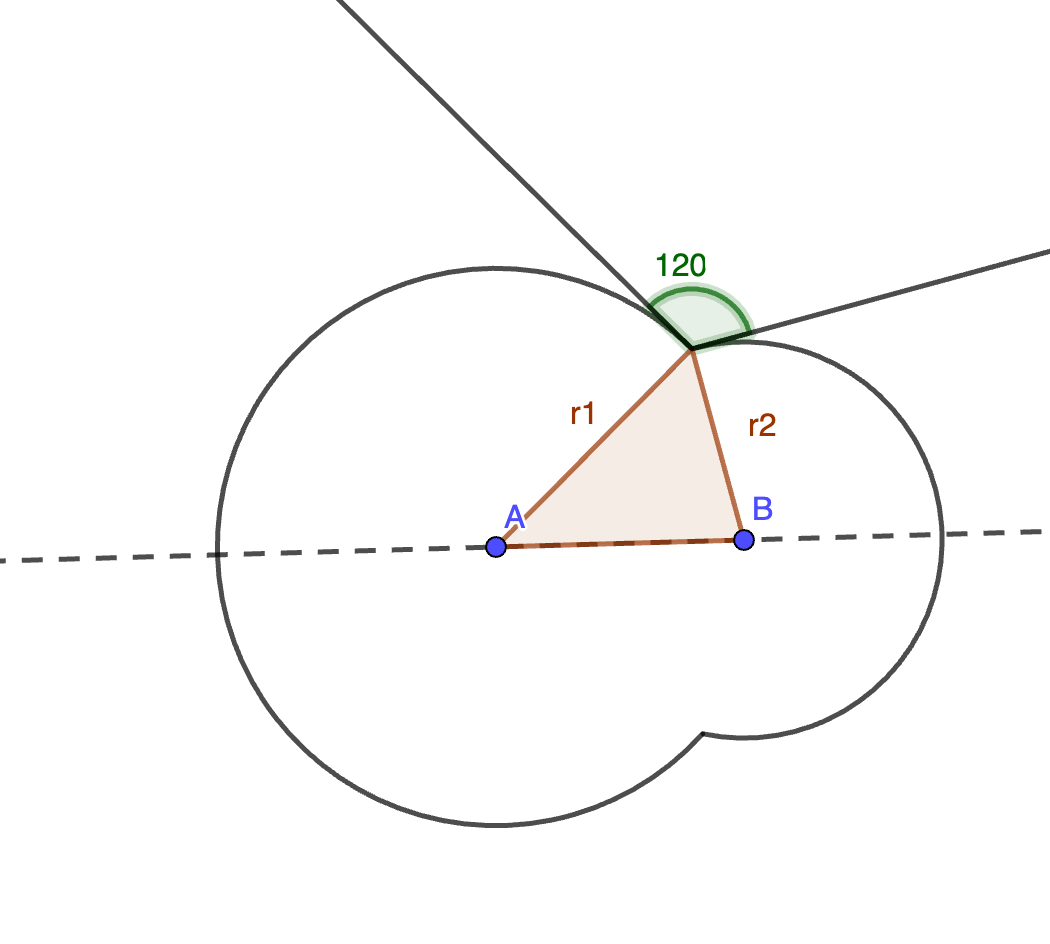
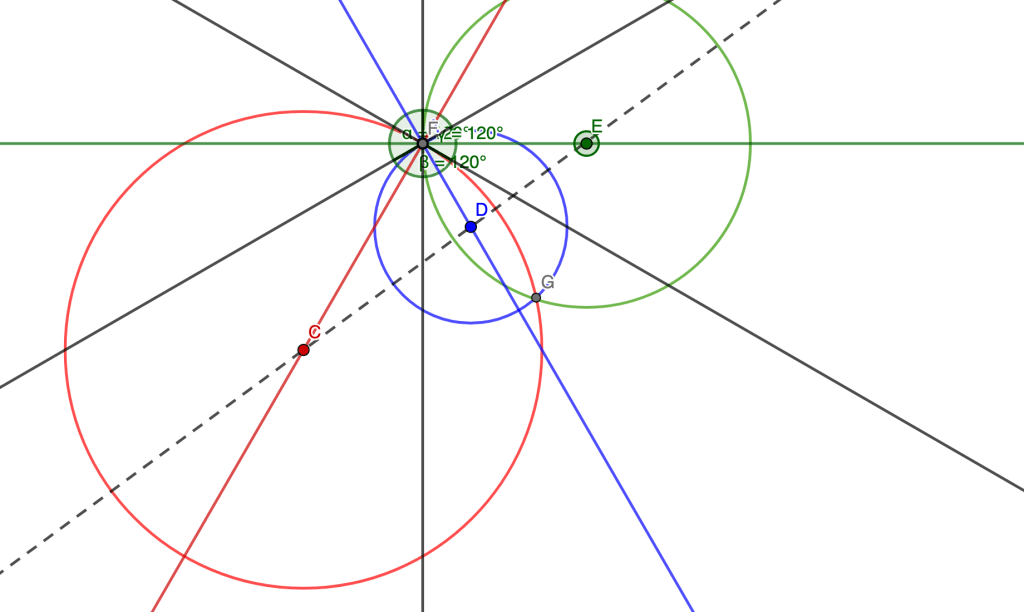
Let’s say I have two circles that “intersect at 120 degrees” like in this diagram below (if you zoom in enough at to the intersection point of the circles, the two circular lines are approximated by the tangent lines I drew, and the tangent lines form 120 degrees to each other):
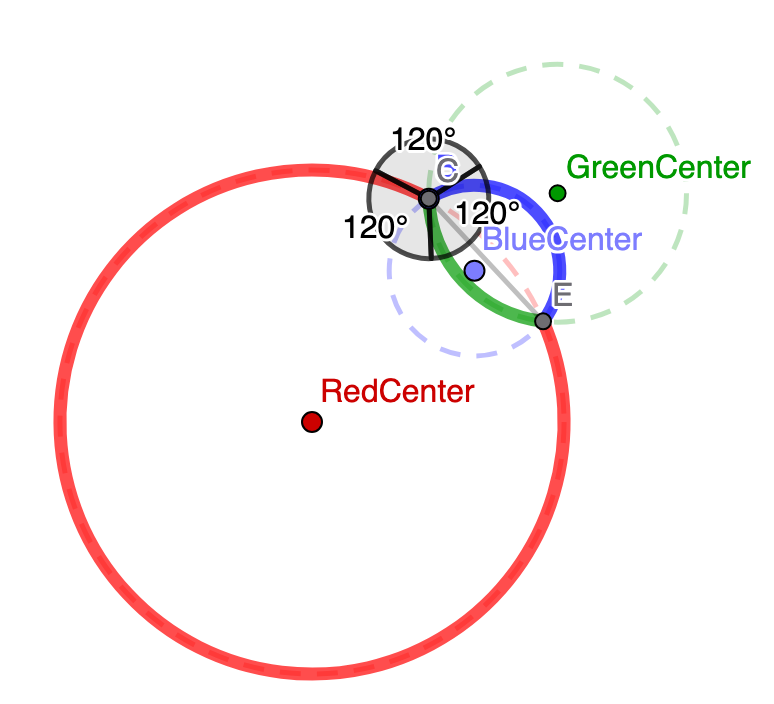
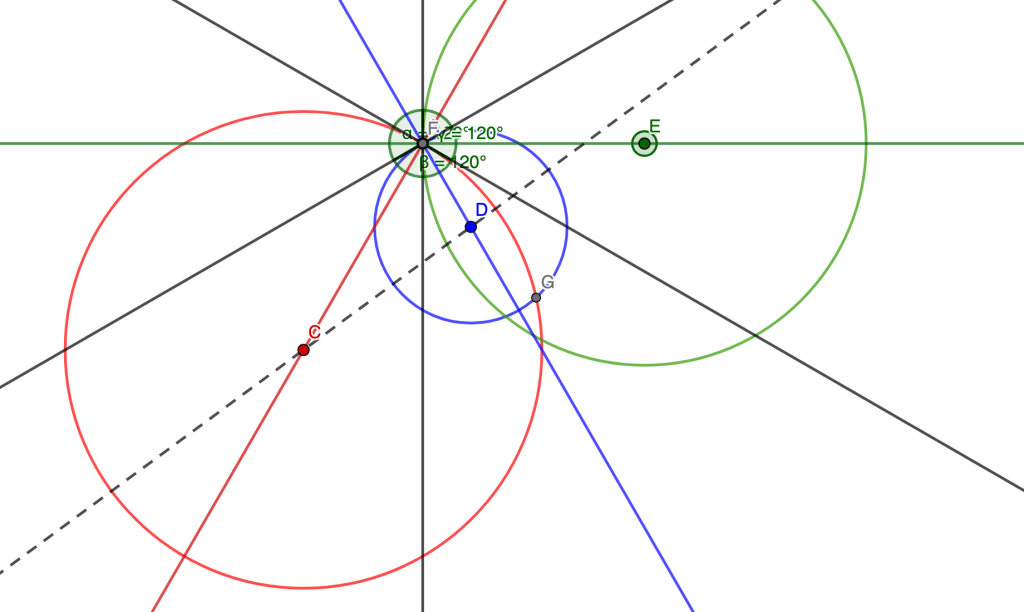
It turns out that there is a THIRD circle which can also intersect with these two circles and form 120 degree angles. Here are some different configurations that showcase this.
The question I’ve been dealing with is this: given the two initial circle radii (the red circle and blue circle, in the pictures above), can I come up with a formula for the radius of the third (green) circle?
I’ve been working for a few days to find the answer. I felt at times I was going in circles (no pun intended), and indeed I was. When I got the answer, I was astounded.
It was much more elegant than I anticipated! Everything simplified in a beautiful way. And my work was so ugly… I mean, I was using the Law of Sines and the Law of Cosines and the sum of angles formula for sine… so after taking a break from the problem, I went back to see if I could do it much more simply, now that I had played around with the problem and better understood the contours of it. I could!
First, I had to show that the angle formed by the radii to the intersection point had to be 60 degrees.
Here’s my work for that, using the fact that the tangent lines to the circles form right angles with the radii.
I next added in the third circle into the picture. Here’s a very not-pretty applet I made [https://www.geogebra.org/classic/wysfbqwn]. Drag point E and see what happens… I’m getting all possible green circles that intersect the red and blue circles at 120 degrees. There are an infinite number of them!
If you just want to see the picture, click through the images below to see what happens as I change the radius of the green circle to gradually bigger and bigger and bigger.
There are an infinite number of green circles that work! However, only one of the green circles also intersects at point G, the other location where the red and blue circles also intersect. So that’s the green circle we want. It took me a hot second to reason out why point E has the lie on the same line as C and D. I’m just trying to get this posted, so I’ll add that reasoning in later if I have time.
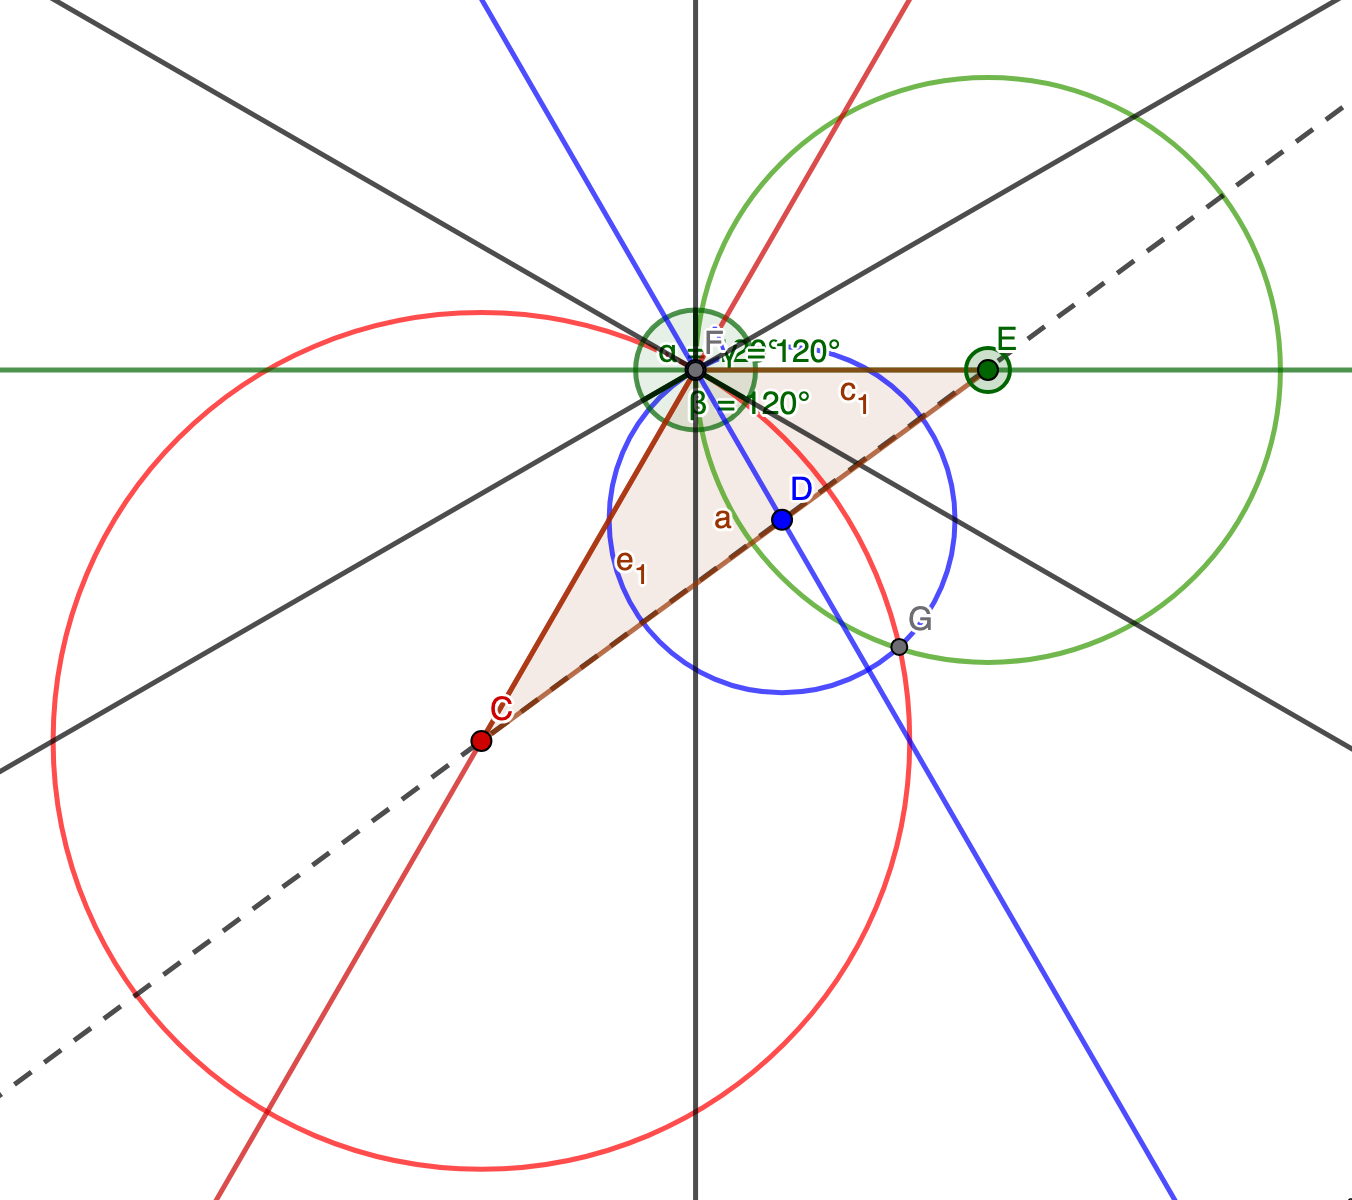
At this point, for me, the problem involves focusing on the triangle highlighted below:
I’m going to look just at the triangle now. We showed that the angle between r1 and r2 is 60 degrees. An identical argument can be used to show that the angle between r2 and r3 is also 60 degrees.
To keep things straight in my head, I highlighted the things we know in yellow. We are given r1 and r2, and we know the two angles are 60 degrees. We just have to find r3, which is the radius of the third green circle!
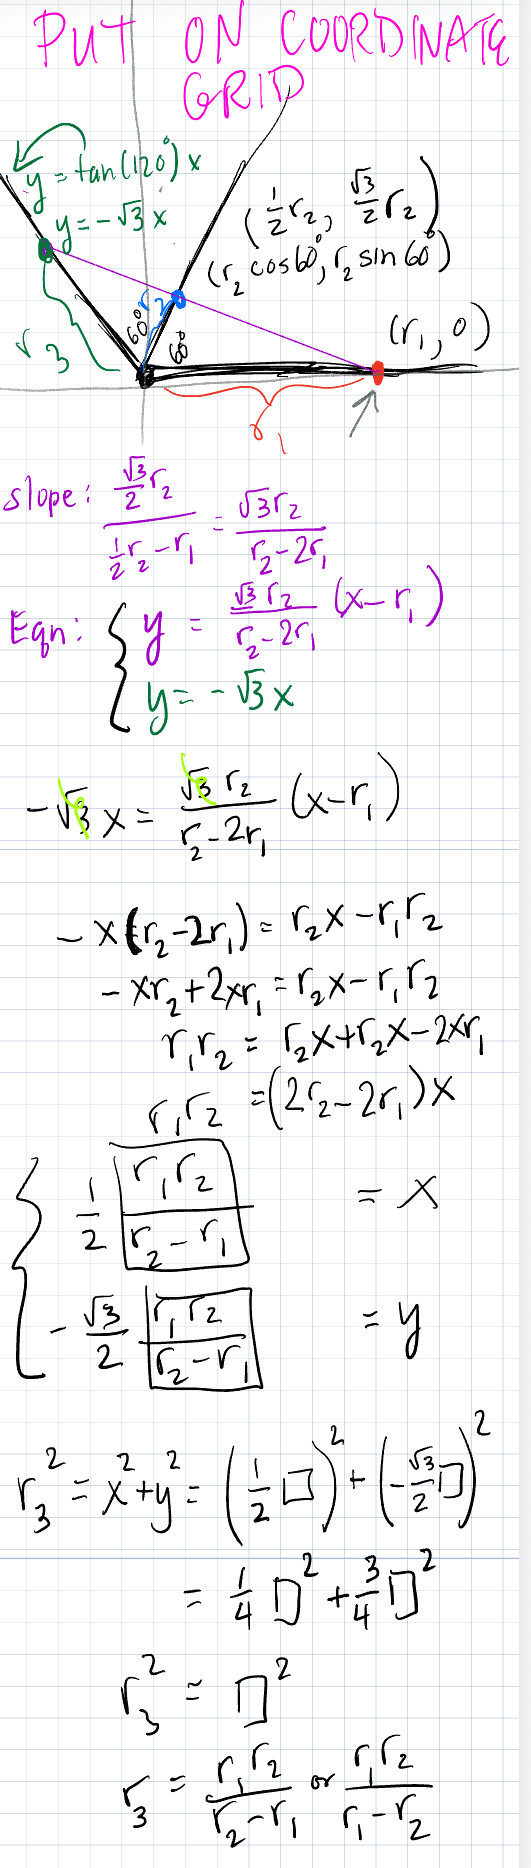
At this point, I think there are lots of things one can do. In my original work, I was using lots of Law of Sines and Law of Cosines. But in my revised work, I didn’t need any of those things. I decided to rotate the triangle.
And the reason I did this is to put everything on a coordinate grid. From here on out, my work just fell out nicely! On the diagram below, I found the equation of the purple line. And then I wrote the equation of the line that forms r3 (what I’ll call the green line). And then I found the intersection point of the purple and green lines (the green point). And then I found the distance from the origin to the green point.
And that formula below is precisely what I found in my messy, convoluted first attempt that took hours and wasn’t as elegant.
Writing this formula in reciprocal form, we get either the first or second formula:
I remember from when I taught multivariable calculus that the measure of curvature of a circle is the reciprocal of the radius. So in that formulation, the curvature of the third circle is the difference in curvature of the other two circles.