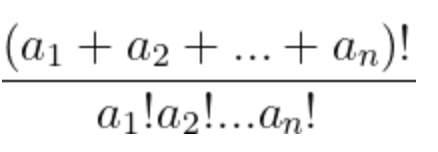
In my last post, I shared a question posed to me by a student. Essentially, it boiled down to: can we algebraically prove that the following will always be an integer?
I shared it with two friends in my department because they both really love combinatorics like me. One gave me some really nice ways to think about it and set me upon a nice path forward. But before I could go there, the other (the illustrious James Cleveland-Tran) shared with me his thinking. It was amazing. I wrote in my last post I love when things I can’t explain (in mathematics) feel like magic, because it means I get to learn something cool to figure out what makes it work. And when I do, when I understand something so well that the magic suddenly feels mundane (I think I used the word “obvious”), that is a wonderful moment. Because that means I fully grasp something. As James shared his thinking with me, I had that moment. Of course this had to be true. It doesn’t involve anything so deep I had to work to get it. It felt simple, and simply put, beautiful. I’m going to share that reasoning here.
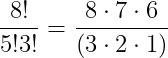
So to start, I want to remind y’all that the things being factorialized and multiplied in the denominator all add up to the numerator. I am going to use a specific example to illustrate this and work through the ideas:
The whole proof hinges on this idea: a product of n consecutive integers will be divisible by n! Since James showed me this, I’ll refer to this as the James’ Theorem.
So let’s look at this example more closely. I’m going to expand out the numerator.
Now I’m going to group the numerator into groups of consecutive integers. Of course you can see we can do this in different ways. Here are some of them!
By James’ Theorem, we know the three consecutive blue numbers in the top of the fraction will evenly divide the 3! in the bottom of the fraction, the four consecutive red numbers in the fraction will evenly divide the 4! in the bottom of the fraction, and the five consecutive yellow numbers will evenly divide the 5! in the bottom of the fraction. And thus we’re done.
Now how do we know James’ Theorem is true?
Okay, I officially hate my life. GOSHDARNIT ALL TO HECK! As I was typing up the rest of this post, showcasing what I thought was a wonderful, deep, clear understanding of something that felt so obvious, I realized I don’t understand it fully. ACK!
And so, again, I’m in the realm of magic again. This isn’t the first time. This happens to me a lot with really interesting problems. I almost always discover a mistake in my reasoning when trying to write up an explanation with simplicity but also being comprehensive. And that’s exactly what happened here. (This is one reason why explaining my reasoning clearly to others is so important in my math process, and why I love kids talking about their mathematical thinking with others! It forces critical self-reflection.)
So here’s where we’re at. I do fully accept that if James’ Theorem is true, then we’re done! But I had a misconception that makes me feel a little embarrassed looking back at things.
I was thinking for each consecutive 5 integers, for example, had one of those integers divisible by 5, a different one had one of those integers divisible by 4, a different one had one of those integers divisible by 3, a different one had one of those divisible by 2, and the last remaining one had one divisible by 1.
Like I’m illustrating here:
But… yeah… that’s not always the case… Here’s the text I sent my friend James…
I’m now wondering about the factorial proof. I agree that if we know that the product of k consecutive integers were divisible by k!, the proof is done. But it’s not obvious to me anymore.
If we have the five numbers 27, 28, 29, 30, 31, I had convinced myself that one was divisible by 5, a different one was divisible by 4, a different one was divisible by 3, a different one was divisible by 2, and the last one was divisible by one. In my mind they had to be different ones. But that doesn’t work here.
And I thought they had to be different because in this case for example when they’re not, you then have to show after you divide one number out you might have to then divide a second number out and I don’t know why the second division necessarily works. Like in this example… after dividing out the 5 and the 4 and the 3… the 2 would have to divide into the 30 or 28. But the 28 already had 4 divided out so it wouldn’t be able to be divisible by 2 (what you’re left with is 7). And it feels magical that the 30, after being divided out by 5, happens to still then be divisible by 2.
In other words, how do I know the 2 will still be able to be divided into the 30 or 28?!?
Of course, I know with this specific example it can divide into the 30 (even after the 5 divides into the 30)… but how do I know if I did this with another set of n consecutive numbers, I wouldn’t hit a place where after you’ve divided out a bunch of numbers, you’re left with a number in the denominator that won’t go into the numerator?
Here’s my current state of things. I believe James’ Theorem and know it will unlock this problem. But I don’t get with any depth why it’s true. So I’m super happy that the original question posed by my student has been reduced to something “smaller.” I also think I might be at the point of wanting to google this to see what I can discover. I am still going to hold off for a bit longer, but I’m not sure how much longer.
Today in class, a student asked a question that stumped me. I haven’t yet given myself a lot of time to think about it, but I went into the city after school for something and on the subway ride home I had my audiobook on and I basically didn’t “hear” anything because my mind kept wandering back to this problem. (Ack! Now I have to rewind like 30 minutes of it.) And so I wanted to share it with you in case you wanted to work on it. Feel free to throw your thoughts in the comments.
We’re studying combinatorics (the art of counting) in precalculus. And we were seeing things like
pop up as answers to counting questions. And each of these evaluates to an integer.
The student asked: “BUT WHY? Why do these happen to evaluate to an integer?”
To give credit to what we’ve been doing in class, we spent about 3-4 days building up a deep conceptual understanding of why these would be the answers to particular counting scenarios, starting with first principles [1]. And we knew, since they were answers to counting problems, and that the number of outcomes to our given scenarios had to be an integer, that these had to evaluate to an integer. I would argue we have formally proved using a conceptual argument they had to turn out to be an integer. I think this is quite elegant! So on a mathematical level, we’re done. We’ve proved it.
However I liked this question a lot because I remember having it myself when I was in high school. And when I was teaching combinatorics for the first time. And randomly every so often since. I absolutely am certain I have thought about this before, and I also am certain I have no memory if I ever answered the question for myself or not. (My mind is like a goldfish.
So I pose it to y’all. On apurely algebraic level, how can we prove the following will be an integer:
Or I’d be okay with an even simpler version: how could we prove (again, purely algebraically, or with number theory, but with no reference to combinatorics) that the following will be an integer:
It’s harder than it looks, at least for me upon initial glance. I mean, I’m me, and needed to ground myself, so I started with a concrete example:
And I did the “canceling” and I saw we have some stuff that happens to divide evenly…
Yay, we see the 6 in the numerator divides out with the 3 and 2 (or the 6 divides out the 3… and 8 divides out the 2). But it feels like happenstance. And the more I wrote up examples, and I saw random things divide out from the denominator into various numbers in the numerator without rhyme or reason, the more happenstansical it all felt. It didn’t leave me to the next step in a proof…
The more examples I did in this very concrete and simplistic way, the more magical it felt. That I could find the right numbers in the numerator to cancel out with the numbers in the denominator — and still be left with an integer at the end! I loved the feeling of magic in math, because it means there’s something that is happening that I don’t understand, that’s ripe to be mined! And the moment I make something magical into something “obvious,” that’s when I know I’ve fully understood something. Right now, I’m in the magical phase.
In any case, I was thinking maybe I need to move forward with a proof by contradiction… or even induction?
I’m not sure if any of this made sense. But if it did, I’d love any thoughts in the comments!
[1] I have a very unique way of introducing combinatorics. At some point I should blog about it! But it basically reduces many, many combinatorial problems to the same type of problem. By the end of our unit, students don’t see “combinations” and “permutations” as different things that are related to each other. We zoom out and end up seeing them as the same thing. And moreso, my approach even lets them solve more complicated problems that combinations and permutations can become a bit more challenging to use. :)
On Thursday, after school, I hopped in an Uber to the airport. I was flying to a conference, the “Teaching Contemporary Mathematics” conference (TCM) held at the North Carolina School of Science and Mathematics. I think I’ve been at least twice over my career, maybe three times, and always found it to be a really solid conference. The big sell for me is that it’s primarily high school math-focused, and most of the sessions are given by actual math teachers about their own teaching practice. And more importantly, it’s felt like forever since I just got to geek out with other math teachers. A fellow teacher from my school and I arrived pretty late and just passed out, with dreams of conference day on Friday.
Although I haven’t blogged in forever, I wanted to at least outline a few things tonight that I can return to. But it’s late and I’m tired, so I’m only going to do a few tidbits.
There were two sessions that got the mathematical side of my brain whirring.
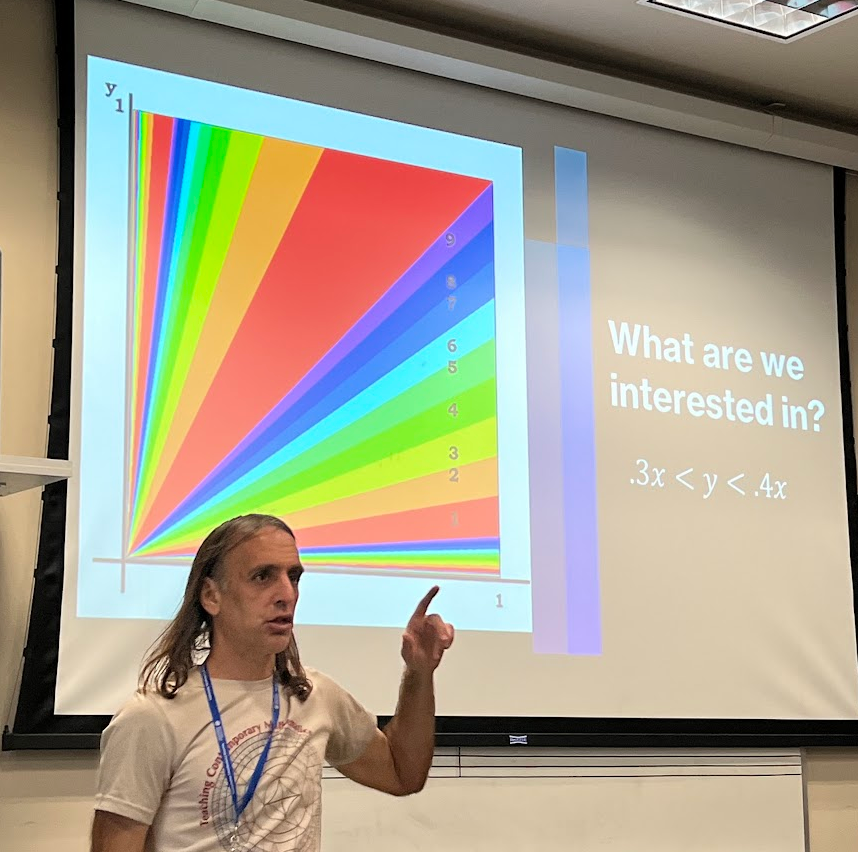
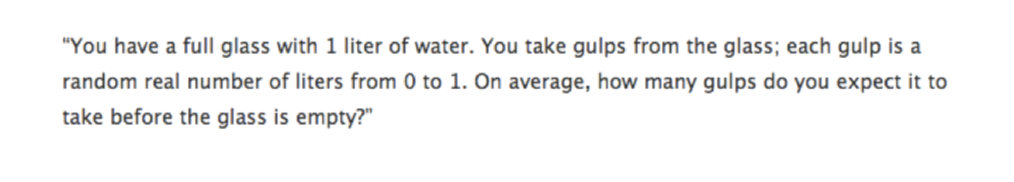
Ryan P gave a talk on “A Rainbow of Random Digits,” where he went from 1D to 2D to 3D to think about a interesting problem. I thought what he showed was beautiful, especially for the 1D and 2D which I could see using with students in a sort of ongoing independent study/investigation. For the 1D question, he asked us if we had two dowels, of length 1 and length 2, and we split the larger dowel into two pieces, what is the probability that the (now three) dowels could form a triangle. A nice fun introductory question with various approaches to answering it. For the 2D question, he asked as a warm up: if you had two numbers chosen randomly between 0 and 1, (a) what is the probability that the sum is greater than the product, and (b) what is the probability that the sum of between 5 and 6? Lovely scaffolding, and the first question requires a little bit of calculus, which is fun. And then the full 2D question (which can be answered using some calculus, but I think it’s even more beautiful without it): if you have two random numbers between 0 and 1, what is the probability that the first non-zero digit of their ratio is a 1? a 2? 3?… 9? Totally fascinating 2D probability space, with lots of “triangle slivers.” To whet your appetite, here it is:
And totally not my intution, but the probability of getting a 1 (33.3%) is greater than the probability of getting a 2 (14.9%) which is greater than the probability of getting a 3 (10.2%), etc. The calculation involves some fun infinite geometric series. All of this was new to me. I also have no idea why getting a 1 digit is more likely than getting a 2 digit which is more likely than getting a 3 digit, etc. My intuition–which was way off–made me think all digits would be equally likely. Now honestly, I don’t know how teachers can actually build something like this problem into their normal classroom practice, but I do know that I’d love to work with a student to get them from the statement of the question to the answer in a lovely set of independent investigations, and some well-thought-out hints to guide. (And maybe chatgpt to write some simple code to do an initial simulation.) My friend and colleague suggested that maybe the distribution might be related to Benford’s law.
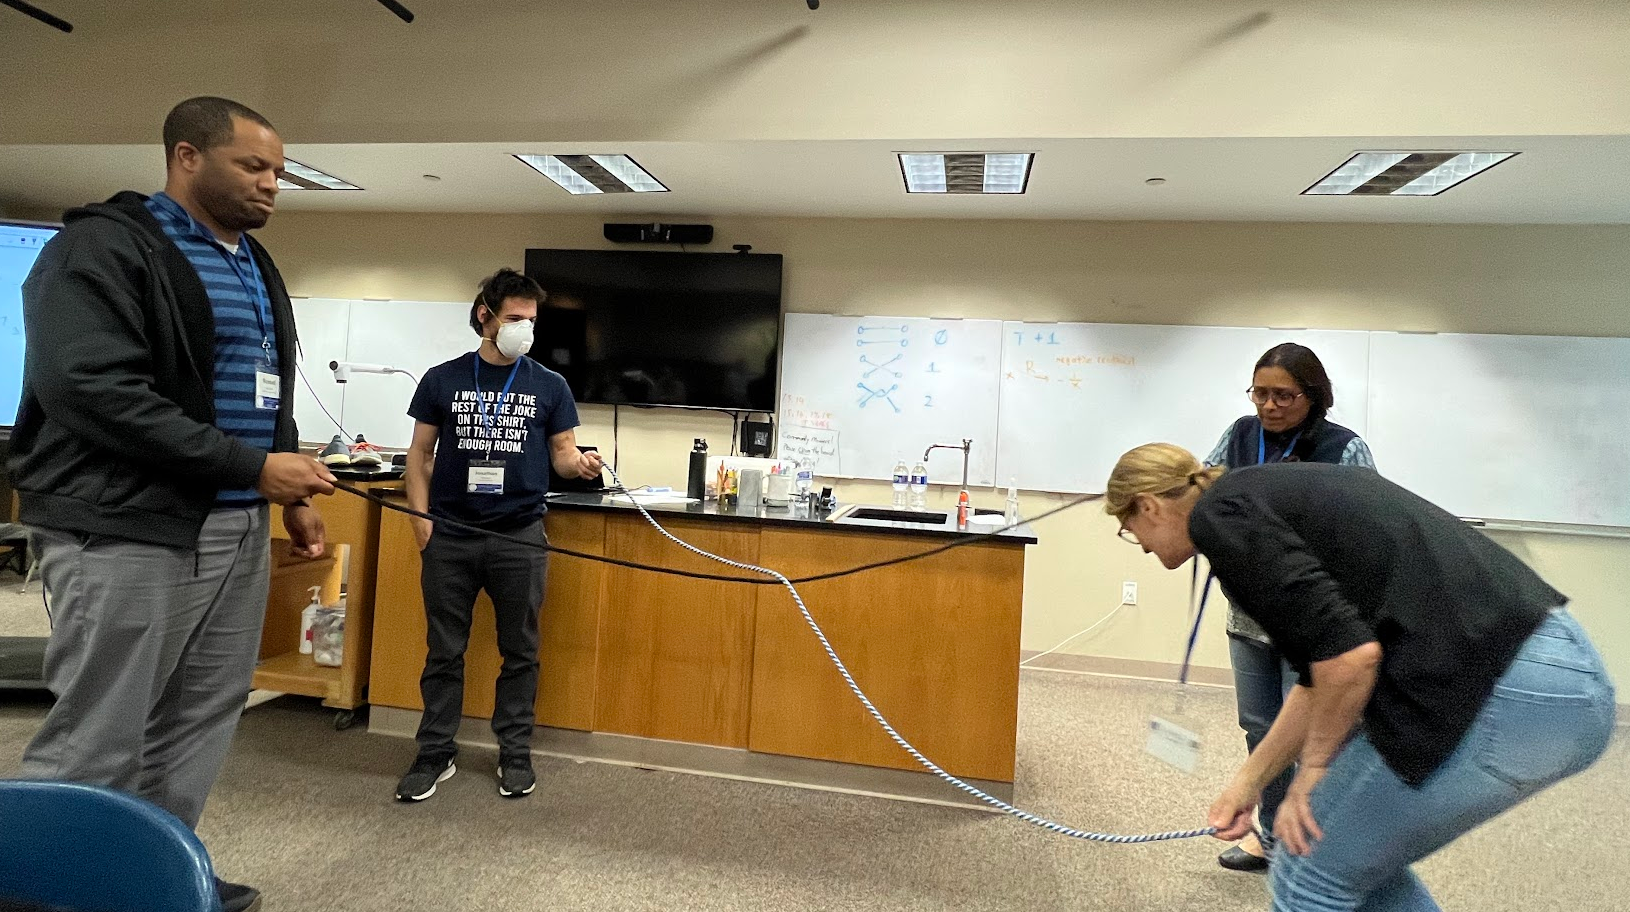
The second session that got the mathematical side of my brain whirring was by Bryan S. He had first learned about Conway’s “Rational Tangles” a few years ago, and wanted to present it to us. Wonderfully, I had first learned about these from Conway himself when I was in high school attending Mathcamp (and Conway was a guest lecturer). Conway was an electric speaker — and this one lecture of his imprinted itself on my mind. Now skip forward to this year. I had students work on “Explore Math!” projects and one worked on knot theory. I mentioned in my feedback to one student I had a really cool knot theory-adjacent thing I learned and I could show her. She responded saying “yes, please!” Of course it’s been years since I learned Rational Tangles. And it’s like the universe said “Oh, let me bring Bryan S. to you to remind you about all the nitty gritty of it.” And he was fabulous — a marvelous instructor who somehow managed to convey the excitement, weirdness, inquiry, all in a single short session. The crux of the setup is that you have two ropes held by four people:
There are two moves: T(wist) which has the front right person and back right person switch positions, where the front right person brings their rope under the back right person’s rope, and R(otate) where the four people just rotate clockwise. It turns out that by doing seqences of moves like this, such as TTRTRTTRT (etc.), you can get a pretty tangled tangle in the middle of the two ropes. One question — the main one we talked about — is if you can do a series of Ts and Rs to “undo” the tangle and get back into the original position of just two untangled ropes. Amazingly, a few Mathcampers created a digital version of this twisting and rotating and it took me about 20 minutes today to find it even though I knew it existed and I had played with it before. Here it is!
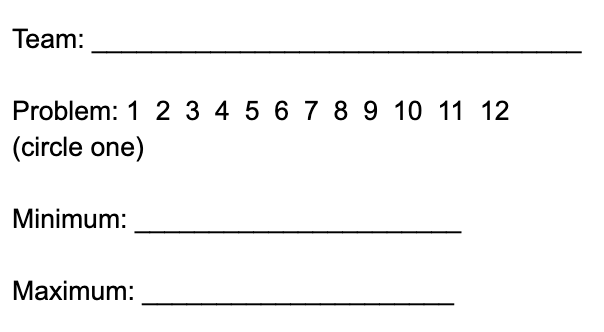
Another session I went to was Chris B’s Estimathon! I participated in my first estimathon at the Park City Math Institute many years ago (and again, a couple years ago). I hated it both times, for a few years. First, I hate estimating. I love thinking and calculating — but Fermi problems? I get really annoyed because I feel I rarely have the adjacent information that can unlock the problem. Second, the other people (both on my team and on all the other teams) were very, very competitive. I prefer a cooperative board game over a competitive board game, and in this, I think I feel similarly. That being said, I really enjoyed doing the estimathon with Chris and our other math conference participants. It was fun because the other people on my team were chill about it, and also let me sort of work alone at times when I got obsessed with a problem. Here are two example questions we were tackling:
Yes, I went to #5 because you can calculate that. Here’s what the scoring sheet looked like:
So you get to guess a minimum value and a maximum value for the range that the answer is in. And your score is ceiling(maximum/minimum). In other words, take the maximum value, divide it by the minimum value, and round up. So min: 2000, max: 3000 would yield a score of 2, and min: 2000 max: 4000 would also yield a score of 2…. but min: 2000, max: 4001 would yield a score of 3. Your goal is to get the lowest score. At the end, Chris gave us the absolute best idea (which I think he got from his colleague Emily). You have kids find out numbers for something that they are passionate about or would be an expert in. It could be “the number of pokemon” or “how many grandchildren does Sameer’s father have?” And then later in the year, you could create an estimathon out of these numbers — where kids have to see what they know about each other and their passions. I love this as a way for people to get to know each other.
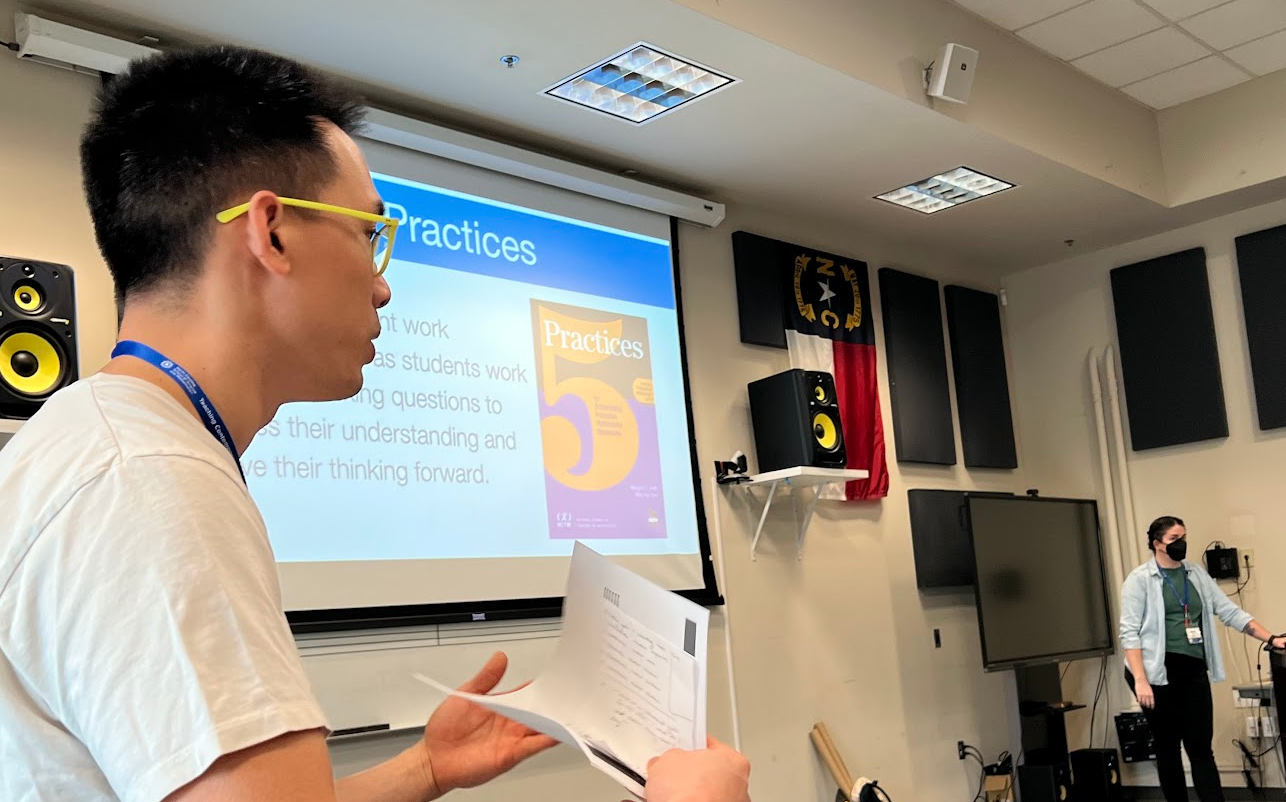
There were two additional sessions that I attended, which were about students and math, and I loved both. First was by Jenny W, Lauren B, and Kevin J, and reminded me of the “5 practices” (https://www.nctm.org/Store/Products/5-Practices-for-Orchestrating-Productive-Mathematics-Discussions,-2nd-edition-(Download)/). It’s about using Desmos to highlight and discuss student thinking and to uplift student brilliance. Although I’ve seen many, many presentions on the 5 practices over the year (especially at PCMI), this was a great reminder of a lot of the things I don’t know, and teacher moves I’ve stopped flexing.
The second was by Lauren B called “I am, We are, You are.” It highlighted a few things to me. First, there’s a gap between the demographics of people who teach mathematics (and their identities) and the population of students who learn math (and their identities). She posed a question (of which she thinks the answer is yes): “Is there a way to expand identity in a math class?” I think this is a great question to chew on — and not easy. Especially if you take away classes like statistics or data science from the mix. We played with a super engaging Desmos activity which gave us choice on which data sets to plot against each other, and the fun part was guessing what the scatter plot would look like before we saw it. And she had a quote from Rochelle Gutierrez (who I’ve met before briefly!) which I couldn’t copy down quickly enough, but went something like “Do I have to be a better you in this classroom, or can I be a better me?” This is a student asking the question — essentially saying “Do I have to mold myself to be a miniature version of you, the teacher, to succeed in this room we’re in together?” I also thought that had a lot to chew on… in terms of what we expect from students and the culture that we build together.
Okay, it’s now 9pm and I’ve been at this for way longer than I intended, so to sleep I go.
***
It’s the next day and the conference has finished and I wanted to archive — briefly — the remaining sessions.
First, Hollylynne L. gave the keynote talk “Data Science is Everywhere and For Everyone.” Some takeaways for me are that there are a few large organizations (like NCTM, NCSM, ASA, etc.) that are collaborating to create a united data science position. It’s drafted, and about to be adopted, and has four guiding principles: (1) data science is contextual and multidisciplinary, (2) data science is an investigative process, (3) data science understanding and experiences are for everyone, and (4) data science educators must develop and practice ethical uses of data. The presenter shared her experience ethnographically observing data scientists for 9 months and what traits they exhibited. Then she shared with us that she feels like data science needs to be presented to kids with larger data sets — in terms both of cases but also in number of attributes shared (e.g. not just a survey with one or two questions, but a survey that has a ton of questions!). As an expert on CODAP, she shared how to fluently use it to show data, ask questions, and then interrogate the data. That part was inspiring, and in only a few minutes showcased the power of CODAP (codap.concord.org). Her talk also got me thinking about how our department has over the years shoved all of data science/statistics to our AT Statistics courses as we were making room for everything else we need to teach. Lastly, at the end, she shared a resource I want to follow up on called InSTEP. It is a free online site [https://instepwithdata.org/public/] that is designed to get teachers ready to teach data science and statistics, and it sounds like you learn lots of content, pedagogical moves, and you learn to use various tech tools but primarily CODAP (which is what I want to learn). So yay!
My next session was by Reed H and was an invigorating conversation on Standards Based Grading. He presented a “post mortem” of him implementing SBG in his precalculus classroom for the first time, sharing why he made the switch but also the tradeoffs that occurred. Although our school is moving in a different direction, I was still curious to see how the SBG conversations were going — and it reminded me how much I liked SBG even though it took me 4 years until I had refined it to the point where I could run it fluidly in my standard calculus classes. Reed’s own observations, and the conversations we had as small and large groups, also reminded me of my own path to SBG, and how I now know there is no single flavor of SBG that is going to work for all, because its success is dependent on so many cultural and institutional factors. And there is no magic bullet that is going to make it suddenly easy.
My last session was by Verónica Z and Doru H and was on Linear Programming and Other Means of Optimization. The presenters shared three ways to do optimization without calculus. First, the standard linear programming. The second was something called the “simplex algorithm.” Honestly, I got very confused at this point, because it isn’t in any way intuitive and I think that part of the presentation was meant for people who knew the method. So I ended up stopping my notes and writing “very confused” on my page. (I did find this example that went through the algorithm that I’m curious to read though, to get the crux of the algorithm, but don’t think it will explain “why” it works.) Finally, we learned the TOPSIS algorithm which was just invented in 1991 (“Technique for Order of Preference by Similarity to Ideal Solution”). New math! And the presenter, Verónica, did a really cool job of showing us how to make a decision of which new phone to buy (out of a choice of three) if we were looking at two variables: picture quality and battery life. It’s such a simple algorithm that — at the highest level — has you develop two new “fake” phones that exist — the best phone and the worst phone — one with the best of the traits of the three phones that exist and one with the worst of the traits of the three phones that exist. We plot all three phones and the best “fake” phone and worst “fake” phone. And then we find the “distance” from each of the three phones to the best and worst “fake” phones, and use those distances to rank the phones. Details are in my notes, but I loved learning new math in the universe, and new math to me!
Lastly, the conference was raffling off math art, and although I didn’t win, a new friend did, and she saw how much I coveted them and offered me hers. I demurred and then eventually accepted.
***
Personal Note: Speakers for the most part shared their slides with attendees. So I’ve downloaded the sessions I went to and saved them on my google drive. But I don’t know if they are officially public, so I’m just linking to them here for my own easy access.
Here are two problems that have gotten me to think a lot.
The first one came from my Precalculus co-teacher James. We had been finishing up our unit on combinatorics and also creating new groups, and he devised a great question. So here’s the two-part problem I posed to my kids:
First Problem: We have a class of 14 students, with two groups of 3 and two groups of 4. If I were to have a computer program randomly create new groups: (a) what is the total number of different configurations/outcomes we could have? (b) what is the probability that your entire group was the exact same if you were in a 4-person group?
I thought I solved it successfully and was feeling really confident. Then James told me I was wrong. Then I tried but didn’t understand his logic. So I made a simpler case, and then I thought I understood it. My brain hurt so much. I kept switching back and forth between a couple different answers. It was marvelous! Finally, I felt like I understood things and felt confident. I shared it with my class, and lo and behold, a couple students got what I got, and a couple students didn’t. But the students who didn’t convinced me with their logic. And then I shared their thinking with James, who didn’t have the same answer, and he too was convinced. And I thoroughly enjoyed being wrong and telling the kids that this problem messed with my head, and they helped me see the light!
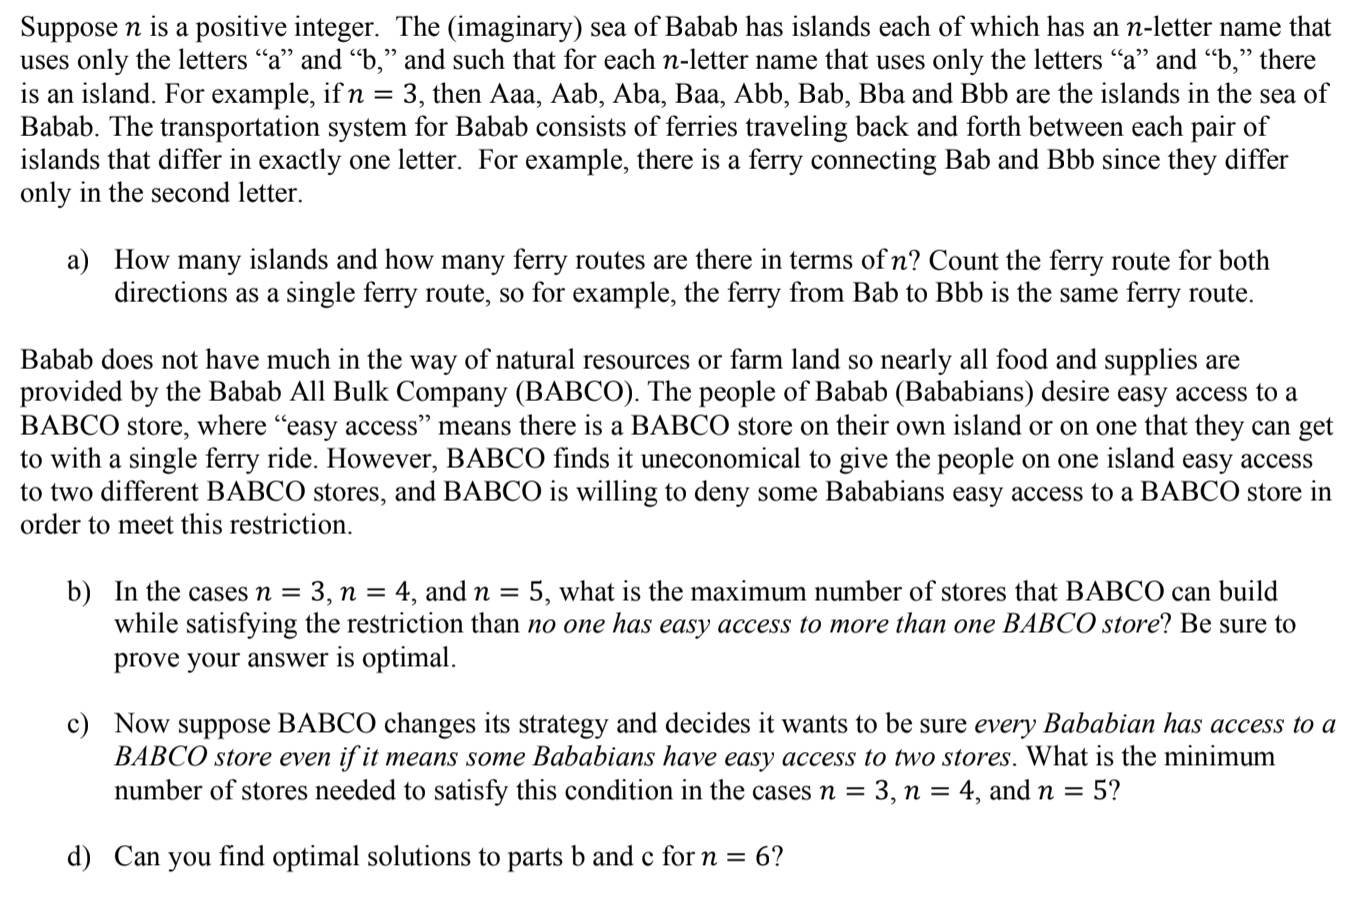
The second problem came from a student who emailed me about wanting to become a better problem solver. And they shared this old entrance exam for this summer camp they were thinking of possibly applying for, and wanted some guidance. The problem that I got nerdsniped by and ended up spending hours working on over Thanksgiving break was as follows:
Second Problem:
This is from the 2019 entrance questions for a summer program. I think I was able to successfully solve (a) and (b). And then I think I solve (c) for n=3 and n=4 (and got an answer for n=5, but haven’t proved it is optimal). And I have no way to even start thinking about (d). But what I thought was lovely is how many different places my brain when went trying to think through this problem. And the neat geometric structure that arises out of the setup. (Even though I wasn’t able to fully exploit this structure in my thinking.)
I haven’t been blogging for a long time. As you can imagine, the pandemic took a toll on teachers, and at least for me and my teacher friends, we were working insane amounts of time, and it was so hard. Emotionally, physically, intellectually. At the time, I just didn’t have it in me to blog about the experience.
But now we’re about to start a new school year. And I’m vaccinated. And my students are vaccinated. And we’re wearing masks. And my classes are going to be with all my kids together in a single room [1], which is such an awesome thing compared to last year.
One of the classes I’m teaching this year is Advanced Precalculus. Another teacher, my friend James, is also teaching the same course. And he’s new to my school this year, and so when talking about the course, he shared with me how he formally incorporated Mathematical Habits of Mind in his teaching in previous years. And interestingly, last year, I toyed with the idea of formally getting kids to be metacognitive about problem solving strategies — but decided to focus on something else instead. So when James shared this idea with me, I got excited.
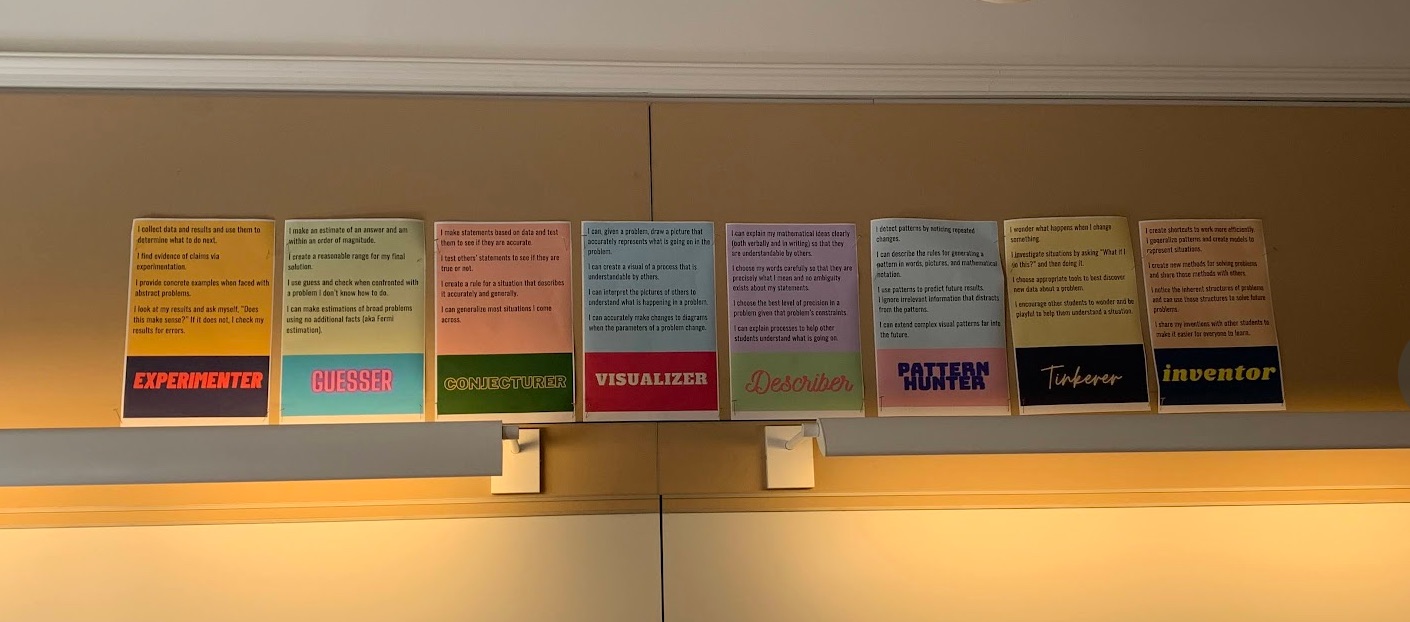
Right now I have an inchoate idea of how this is going to unfold. Hopefully I’ll blog about it! But for now, I wanted to share with you posters I made using James’ Mathematical Habits of Mind. Most importantly, here is a link to James’ original blogpost with his habits of mind and rubric.
Photo of the posters hung up in one of my rooms:
I know, I know, the lighting is terrible. The key words are:
Of course, if you’re a math teacher, you know there are a lot of lists of mathematical habits of mind. We agreed to use the ones James had already been using. But there are many alternative or additional things we could have included.
At the very least, I know that as we get kids to think about what strategies they’re using to solve problems, we’ll also see where there are lacuna in our curricula in terms of using those strategies. Or maybe we’ll discover it doesn’t have as much problem solving as I imagined in it. All entirely possible, since we — the kids and James and I — will all be looking through what we’re doing through our metacognitive Mathematical Habits of Mind lens.
[1] The reason I note this is because at the end of last year, I was teaching students live simultaneously in three places: they were in two different classrooms and there were a few at home on zoom. Yes, seriously. When I mention that to teachers and non-teachers alike, they asked how that was even possible. It was… a lot.
I’m teaching Algebra 2 this year and the other teacher and I decided that we should introduce e to our kids. The reason it’s challenging is that it’s hard to motivate in any real way. You can do compound interest, but that doesn’t do much for you in terms of highlighting how important the number is. [1] I asked on Twitter for some help, and I got a ton of amazing responses (read them all here). My mind was blown. This year, though, I didn’t have time to execute my plan that I outlined at the bottom of that post. So here’s what I did:
The core part of what I did to get the number to pop up was to use @lukeselfwalker’s Desmos activity. I like it for so many reasons, but I’ll list a few here. It starts by “building up” a more and more complicated polynomial of the form , but in a super concrete way so kids can see the polynomial for different n-values. It shows why the x-intercept travels more and more left as you increase n, so when you finally (in the class discussion) talk about what happens when n goes to infinity, you can have kids understand this is how to “build” a horizontal asymptote. It gets kid saying trying to articulate sentences like “this number is increasing, but slower and slower” (when talking about the value of the polynomial when . And they see how this polynomial gets to look more and more like an exponential function as you increase the value of n. If you want to introduce e, this is one fantastic way to do it.
A few days later, I had everyone put their stuff down and take only a calculator with them. They paired up. (If someone didn’t have a pair, it would be fine… they just sit out the first round.) On the count of three, both people say a number between 0 and 5. (I reinforce the number doesn’t have to be an integer, so it can be 4.5 or something.)Then using their calculators, they calculate their score: they take their number and raise it to their competitor’s number. The winner has the higher number. (If it’s a tie, they go again until there is a winner.)
Then the loser is done. They “tag” along with the winner and cheer them on as they find another winner to play. This goes on. By the end, you have the class divided into two groups each cheering on one person. (I learned this game this year as an ice breaker for a large group… it’s awesome. This is the best youtube video I could find showing it.)
Finally there is a class winner.
So I then went up against them.
And when we both said our numbers, I said: e.
The class groans, realizing it was all a trick and I was going to win. We did the calculations. I obviously won.
We sit down and I show them on my laptop how this works:
The red graph is my score, for any student number chosen ().
The blue graph is the student score, for any student number chosen ().
Clearly I will always win, except for if my opponent picks e.
I tell kids they can win money off of their parents by playing this game for quarters, losing a few times, and then doing a triple or nothing contest where they then play 2.718. WINNER WINNER CHICKEN DINNER!
After this, I show kids these additionally cool things (from the blogpost), saying I just learned them and don’t know why they work (yet), but that’s what makes them so intriguing to me! And more importantly, they all seem to have nothing to do with one another, but e pops up in all of them!
I re-emphasize e is a number like and I showed them this to explain that it pops up in all these places in math that seem to have nothing to do with that polynomial we saw. And that even though we don’t have time to explore e in depth, that I wanted them to get a glimpse of why it was important enough to have a mathematical constant for it, and why their calculators have built in e and ln.
That is all. I honestly really just wrote this just because I was excited by the “game” I made out of one of the properties of e and wanted to archive it so I would remember it. (And in case someone out there in the blogoversesphere might want to try it.)
UPDATE: Coconspirator in math teaching at my school, Tom James (blogs here) created the checkerboard experiment using some code. You can access the code/alter the code here. The darker the square, the more times the number for the square has been called by the random number generator. And with some updates, you can make more squares! In the future, we can give this to kids and have them figure out an approximation for e.
[1] And introducing it with compound interest means you have to assume 100% interest compounded continuously. Where are you going to get 100% interest?!?!
I remember when I first heard about Clothesline Math, I was excited by all the possibilities. And in a few conference sessions with Chris Shore, I saw there was so much more than I had even imagined that one could do with it!
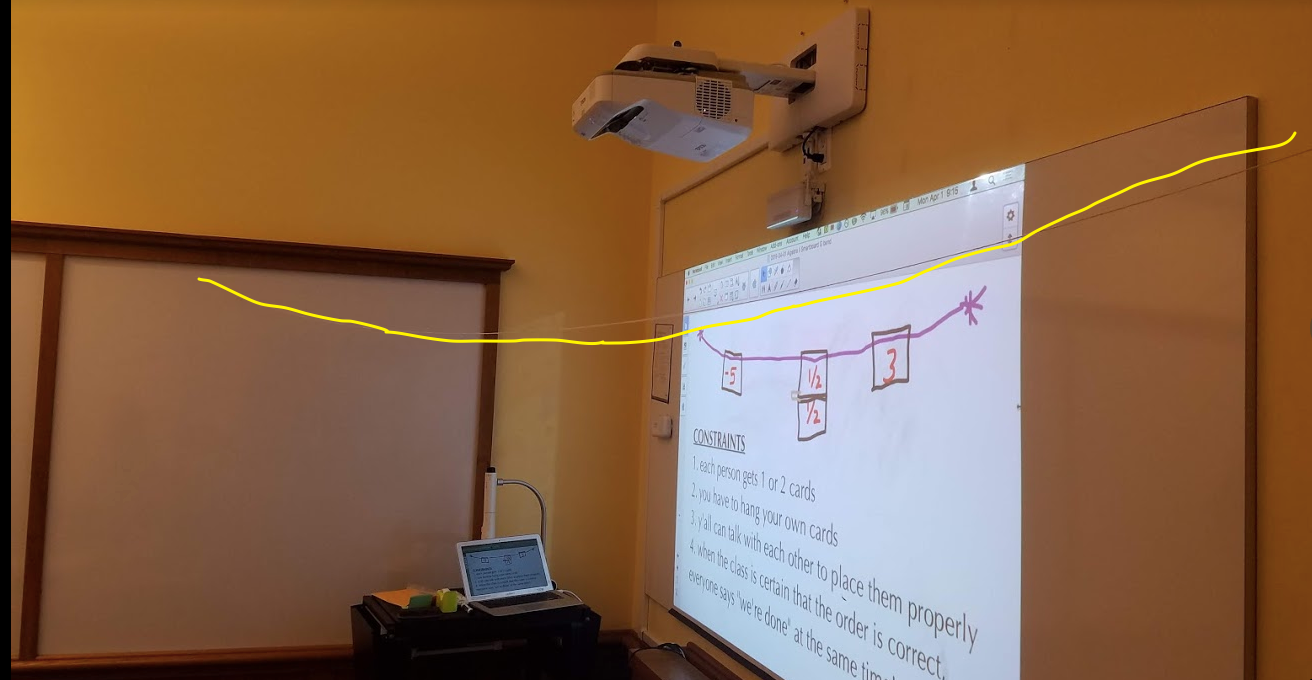
It’s basically a number line, that’s all. But it’s a nice public giant number line which can get kids talking. Today I came back from spring break and before break, students learned about logarithms. However I wanted to have them recall what precisely logarithms were… so I created a quick Clothesline Math activity.
I hung a string in the classroom. I highlighted it in yellow because you can’t really see it in the photo…
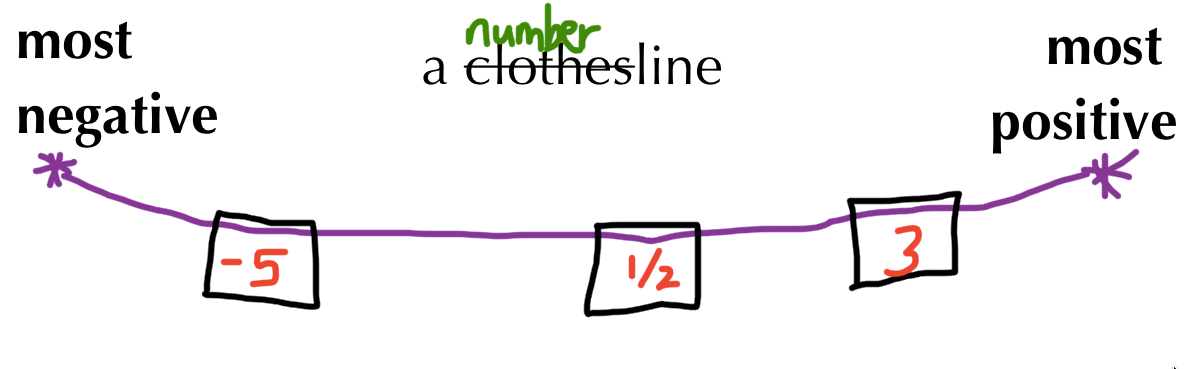
I then showed them this slide – explaining the string is a number line…
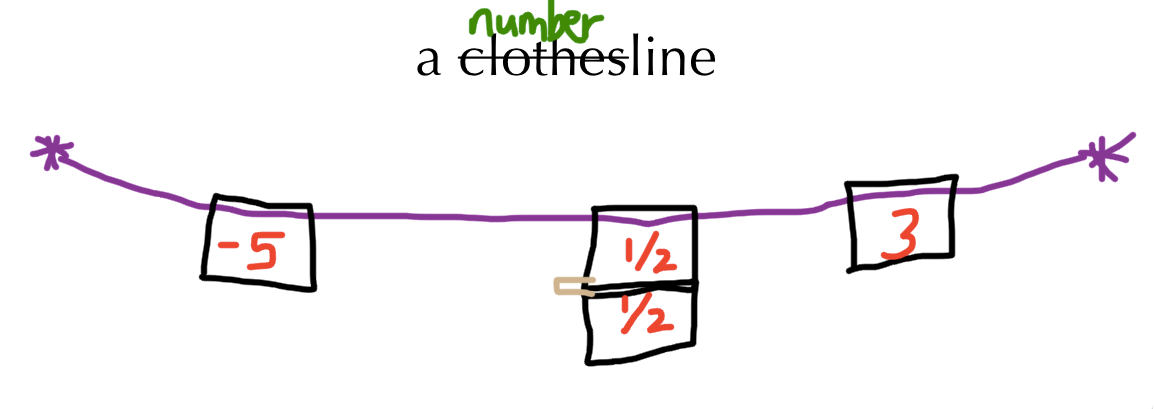
I then showed them this slide, which explains what they have to do if they get two of the same number. (I brought cute little clothespins, but mini binder clips or paperclips would have worked just as well):
And then I gave them the rules of play:
I handed out the cards and let kids go. It was nice to see they didn’t get tripped up as a class on too many of them, but I got to listen to debates over a few trickier ones, which we collectively resolved at the end.
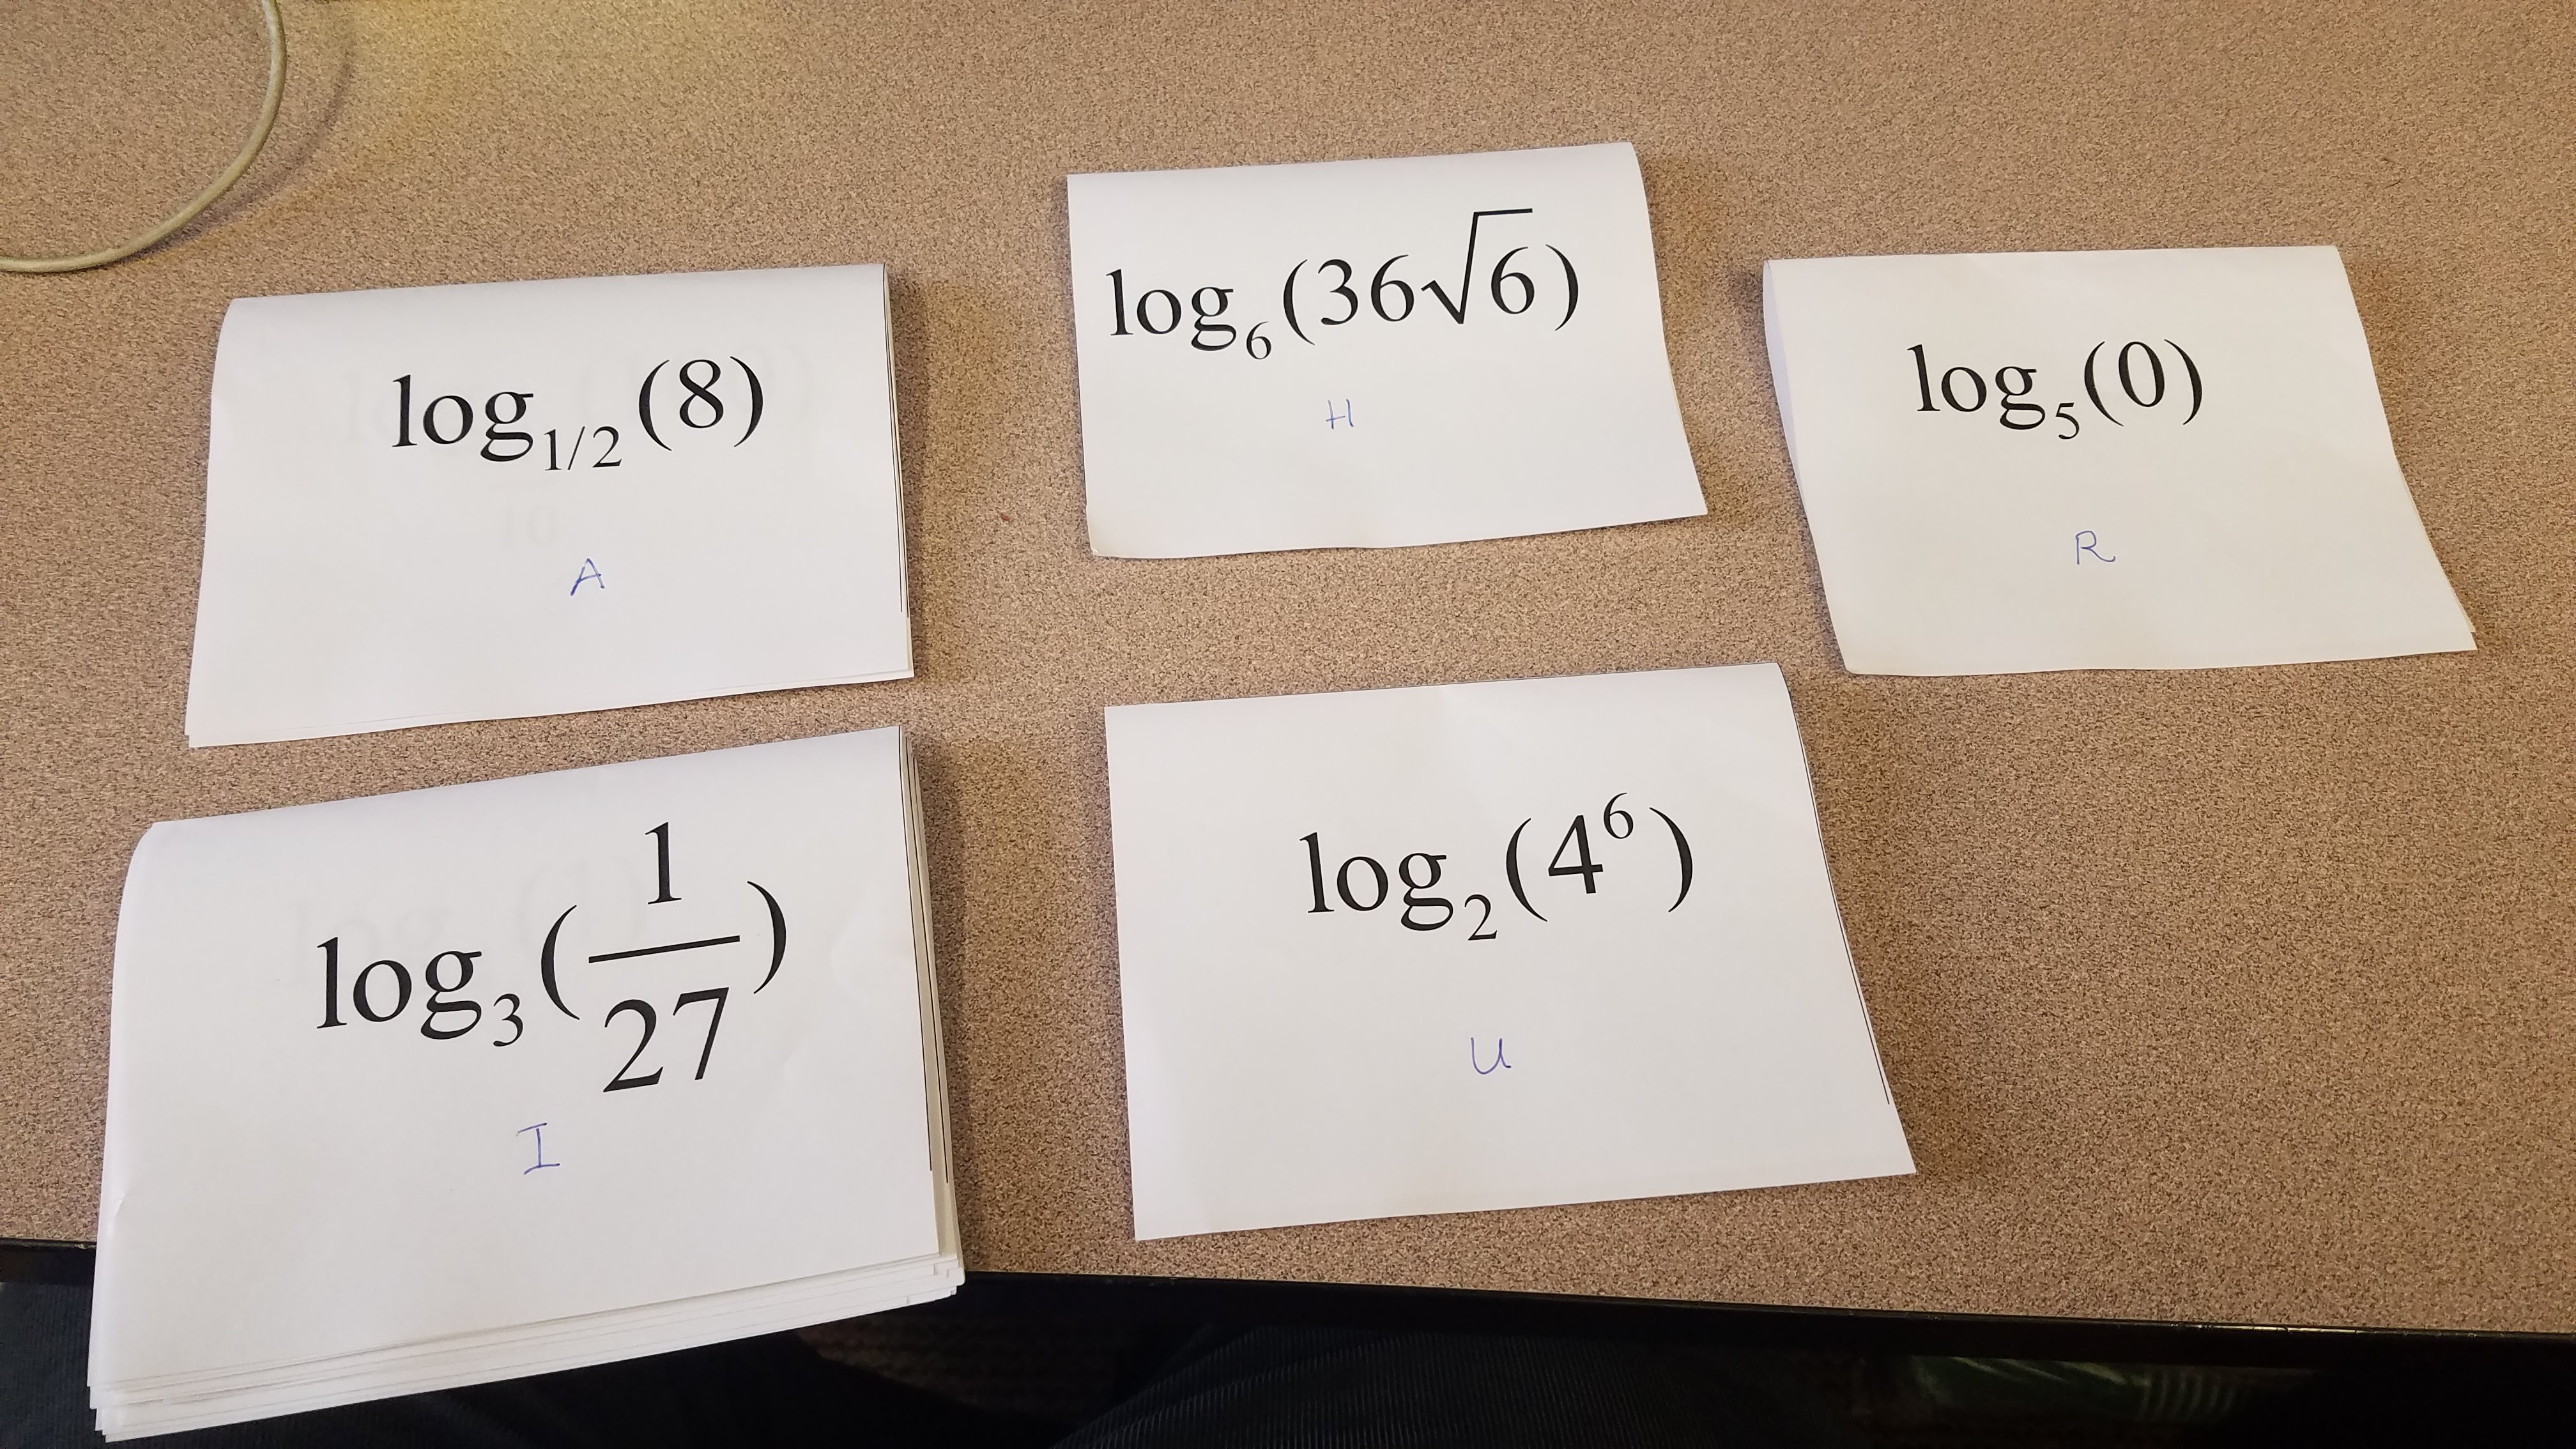
Here is a picture of some of the cards. The two on the left are average level of difficulty. The two in the middle caused my kids to pause… it took them time to think things through (they haven’t learned any log properties yet). The one on the right doesn’t belong on the number one (it is undefined) and the kid who got that card immediately knew that. Huzzah!
Here’s a picture of the numberline at the end.
And… that’s it!
I was excited to try it out as a quick review activity. And it worked perfectly for that!
(Other things of note: Mary Bourassa made a clothesline math for log properties and shares that here. The author of Give Me A Sine blog does something similar here, but has kids create the cards. I couldn’t find anything with basic log expressions — so I made ’em and am sharing them in this post. Chris Hunter has a nice tarsia puzzle that sticks with basic log expressions here, but I wanted to try out clothesline math so I didn’t use that!) But if anyone has others out there involving logs, I’d love to see them in the comments!)


 , but in a super concrete way so kids can see the polynomial for different n-values. It shows why the x-intercept travels more and more left as you increase n, so when you finally (in the class discussion) talk about what happens when n goes to infinity, you can have kids understand this is how to “build” a horizontal asymptote. It gets kid saying trying to articulate sentences like “this number is increasing, but slower and slower” (when talking about the value of the polynomial when
  . And they see how this polynomial gets to look more and more like an exponential function as you increase the value of n. If you want to introduce e, this is one fantastic way to do it.
 ).
). ).
).
 and I showed them this to explain that it pops up in all these places in math that seem to have nothing to do with that polynomial we saw. And that even though we don’t have time to explore