The worst thing ever is when I look back at when I last posted, and it’s over a month ago. Shame on me. After spending all that time trying to inspire others to post semi-regularly, I have fallen amiss. I only feign busyness. Lots and lots of busyness. The reason? I’m teaching a new course. And I’m collaborating with teachers this year. And I’m exhausted all the time.
But I do have some things to write about! Today I’m going to write about something the other calculus teacher and I spent a while emphasizing. It’s the idea of holes and vertical asymptotes in rational functions. There is something about how formulaic students learn about holes and vertical asymptotes in precalculus. And they memorize rules — and not why.
No Drama, no more no more drama! (Holes)
In class I throw up the following slide and have half the kids fill in the top table, and half the kids fill up the bottom table.

It’s a race (those that fill in the top function win!)! And of course, they start filling it in and see that the top function has all y-values are 1 (except for the one y-value that does not exist)… And the bottom one, they start seeing that the y-coordinate is always one less than the x-coordinate. (I sometimes have to do a little prodding.) I ask them why those things were happening, and we have a big discussion.
I forbid the use of the word “cancel.” It is like “Voldemort.” Verboten.

For things like  , I have all kids say “the 3s divide out to equal 1.” Why? Because kids don’t really know what cancelling is, and by “crossing” terms out in the numerator and denominator, they don’t think about what it is they are doing.
Also, they think that  is the same as
  . Which is not true. So they learn to say is the same as except for when
  .
.
What’s nice is once they get that distinction down, we look at the graphs and see that we have a missing point. Which is simply the one point where the function is undefined. So when I ask them why the graph of  looks like the line
  , they can say that they can rewrite
  , and they can say that for all
  values except for
  , the function is essentially
  . And at , the function simply is undefined (why? because
  is undefined at that single value).
So since for almost all values, the expression is just 1, and 1 times anything is itself. So the presence of this term doesn’t cause any drama. Just that one undefined point.
It’s no drama.
Drama! (Vertical Asymptotes)
Very early on in the algebra bootcamp for limits, I threw this on as a do now:

And they saw (and we talked about) why a big number (compared to the bottom number) divided by a small number is a huuuuge number.
Later in the class, I asked them what they remembered about vertical asymptotes. Someone inevitably said “they occur when the denominator of a rational function is zero!” I go “ooooooh, right, okay!” and I throw this up and ask them where the vertical asymptotes are…

… and they respond with what I wrote about. Never have I had a class say “oh there might be a hole!” (even though we had previously talked about them… sometimes during the same class!). But I really lead them on, and I give positive affirmation.
Then I throw up the pictures of the graphs, and we see if we were correct.

And so we saw that that wasn’t right. And they go “oh, right, the holes!”… so we modify our page…

… and talk about how it is not sufficient to say that vertical asymptotes occur when the denominator is zero.
From this, I really emphasize the importance of truly understanding what a vertical asymptote is, what a hole is, and gaining deep conceptual understanding as to what is going on. Memorization equals death.
Finally, to talk about vertical asymptotes, I show  and talk about why a vertical asymptote occurs at . And we relate this to the original do now.
The simple argument goes that for values near , the denominator gets close to zero. And we see that 1 divided by a number very close to zero is going to be very very very large (the function is blowing up!) or very very very negative (the function is blowing down!). Thus, we can clearly see as we get values closer and closer to 2, the function is getting closer and closer to positive or negative infinity.
Thus, we have drama. Tons and tons of drama — especially near . Thus, vertical asymptotes are the consequence of a term that provides high drama.
(I also throw up  and we talk about whether this has any vertical asymptotes and why.)
So we get that. Finally, I encourage students to rewrite rational equations to see all the drama and no drama parts so when they analyze a rational equation, they can understand why certain things are happening…
For example 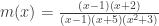 can be rewritten
  . And then they can analyze each part separately to get a sense of how it contributes to the whole function.
That’s all. Nothing special. But I really like the idea of no drama / drama. The other calc teacher and I came up with that idea. The rewriting came out of that approach, and I really like it! I think I’m going to make it more formalized / have specific practice with rational functions based around this approach next year. This year it sort of came into being, so it as clear as I really wanted it to be to my students. But they, for the most part, got it.


 at
at  .
.
 . On the right column
  . Have them use the interval
 ![[0,0.001]](https://s0.wp.com/latex.php?latex=%5B0%2C0.001%5D&bg=ffffff&fg=333333&s=0&c=20201002) to estimate the instantaneous rate of change at
to estimate the instantaneous rate of change at 


 . Or whatever. Knowing there is a publication you can direct the student to, as a way to say “hey, you’re doing something awesome… seriously… so awesome I think you kind of have to share it with others!” is going to be so cool for teachers. (As a random aside, I was thinking I could enlist the help of the art and photography teachers, because of the overlap between math and art… They might make an assignment based around something mathematical/geometrical, which students can submit…)