Algebra II

Composition of Functions and their Inverses

In Algebra II, we have been talking about inverses, and compositions. We finally got to the point where we are asking:

what is f^{-1}(f(x)) and what is f(f^{-1}(x))?

Last year, to illustrate that both equaled x, I showed them a bunch of examples, and I pretty much said… by the property of it working out for a bunch of different examples… that it was true. However, that sort of hand-waving explanation didn’t sit well with me. Not that there are times when handwaving isn’t appropriate, but this was something that they should get. If they truly understand inverse functions, they really should understand why both compositions above should equal x.

So today in class, we started reviewed what we’ve covered about inverses… I told them it’s a “reversal”… you’re swapping every point of a function (x,y) with (y,x). That reversal graphically looks like a reflection over the line y=x. Of course, that makes sense, because we’re replacing every y with an x — and that’s the equation that does that. My kids get all this. Which is great. They even get, to some degree, that the domains and ranges of functions and their inverses get swapped because of this.

But then when I say:

f(x) means you plug in x and you get out y… but then when you plug that new y into your f^{-1}(y) you’ll be getting x out again”

their eyes glaze over and I sense fear.

So I came up with this really great way to illustrate exactly what inverses are and how the work… on the ground. I put up the following slide and we talked about what actually we were doing when we inputted an x value into both the function and the inverse:

comp1

We came up with this:

comp2

We then talked about how we noticed that the two sides were “opposites.” Add 1, subtract 1. Multiply by 2, divide by 2. Cube, cube root. And, importantly, that they were in the opposite order.

Then we calculated f^{-1}(f(3)):

Starting with the inner function: f(3)

(1) cube: 27
(2) multiply by 2: 54
(3) add 1: 55

Then we plugged that into the outer function: f^{-1}(55)

(1) subtract 1: 54
(2) divide by 2: 27
(3) cube root: 3

This way, the students could actually see how a composition of a function and its inverse actually gives you the original input back. They could see how each step in the function was undone by the inverse function.

I don’t know… maybe this is common to how y’all teach it. But it was such a revelation for me! I loved teaching it this way because the concept became concrete.[1]

[1] I remember reading some blog some months ago that was talking about solving equations, and how each step in an attempt to get x alone was like unwrapping a present. I like that analogy, even though the particular post and blog eludes me. But in those terms, this is like wrapping a present, and then unwrapping it!

Query for Teachers: Exponential & Logarithmic Equations

I have a question for you. In a day or two I’m going to be teaching exponential functions, followed by logarithmic functions. These are historically very difficult for our students (and I’m assuming your students too). One idea I had to making things easier is to separate “e” from the lessons totally. I’m thinking that teaching a difficult topic, and then integrating another foreign concept at the same time, has been part of the problem.

(Just like last year I taught quadratics, and when we saw the square root of negative numbers, I taught complex numbers. It arose naturally, but it was too much for my students. This year I taught complex numbers as a short mini unit before embarking on quadratics, and things went amazingly!)

I was going to teach exponential equations and logarithmic equations without “e.” Then when students had done everything, I was going to spend a few days introducing e and applying what we had learned to it.

What do you think? Do you do something similar?

Also, if you have any good ideas on teaching these topics, or good activities, or good resources, or even good questions/problems, please leave them in the comments. I want my students to really get and appreciate the concepts this year.

Moving Day!

I found a new apartment that I’m in love with, and I’m moving at the beginning of May. I called two moving companies which had been recommended to me to get price estimates.

Both will send 3 people.

Company A charges $100/hr for their services. However, they have a 2.5 hour minimum charge. They also charge $100 for 1 hour of travel time (30 minutes to the apartment and 30 minutes from the apartment). There is an additional fee of $50 for packing charges for my futon, mattress, and TV. Lastly, they charge by the quarter hour. So if they worked 151 minutes, they’d charge me for 2.75 hours.

Company B charges $130/hr for their services. They have a 2 hour minimum charge. They also charge a travel fee, but it is only $65 in total. Lastly, they too charge by the quarter hour. So if they worked 121 minutes, they’d charge me for 2.25 hours.

The question I was left with is: which is the better company for me to hire?

The only variable is the amount of time the movers spend moving.

moving-companies1

The x-axis is the hours spent moving, the y-axis is the amount of money my bank account will be missing. Company A is in blue, Company B is in red.

What’s awesome is that we just taught functions and function transformations in my Algebra II class. And one of the functions we worked with a lot was the floor (step) function. We’ve also talked about piecewise functions. If I were teaching an accelerated class, I would literally give them the information and ask them to (a) first produce the graph,  and then (b) from the graph, come up with a function that gives them the graph.

They’re going to have to recognize they’ll need a piecewise equation, and then also have to figure out how to make the function transformations on the step function to get the second half of the piecewise equation.

I kind of love this problem.

Function Transformations

On the Friday before Spring Break, I gave my Algebra II class a quiz on function transformations. It only had reflections about the x- and y-axes, and vertical and horizontal shifting.

I know, I know, you can’t believe how cruel I am, doing something in class the last day before Spring Break. 

Now that we’ve gotten that out of our system, back to the point at hand. Today, I finally got around to grading them. And I have to say that I was really pleased with the results. With the exception of one or two exams, all students did really well.

I told students they needed to memorize the eight standard functions and key points on them (the standard functions include y=x^3, y=|x|, and y=floor(x)). Key points are points I require to be correct on all graphs — after the transformations, they need to be in the right place. So, for example, I require students to know that (-2,-8), (-1,-1), (0,0), (1,1), and (2,8) on y=x^3, and then when  they were asked to graph y=-(-x+1)^3+1
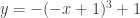
, they need to make sure each of those five points are in the correct place. 

A few students — as expected — mixed up translating right/left. And a few performed the reflections last (when they have to perform them before they do any translations up/down/left/right. But yeah, few and far between.

My favorite part of the exam was giving students a graph like:

picture-11

I asked my students to give me the equation describing the graph. Most students rocked that part, even though I only gave them one problem of the same sort as a warm up. I don’t know why I didn’t give them problems like this last year — they require students to really think hard about function transformations to work backwards.

The one question that students almost universally bombed, which made me want to turn myself into a sheet of paper and crumple myself up and throw myself in the wastebasket, was the “explain” problem. The question read something like “Explain in words why y=-\sqrt{x} is a reflection of y=\sqrt{x} over the x-axis. You may want to use a diagram/graph and a table of values to explain your answer.” 

What’s clear to me is that, frankly, my students still have no idea how to explain their ideas in words. I have given questions like this on each assessment, but previously we had a discussion about the concept and how one would go about answering the question. This time, I threw the question on to see if they could do it themselves. Clearly not.

Next year I am going to have to come up with a good way to integrate these “explain” questions in the course. Perhaps I’ll come up with a list of possible questions for each test and hand them out — so students can try to properly prepare their answers. And after each exam, I’ll hand out a list of possible answers and having a discussion about which are good, which are bad, and which are mediocre — and why. (In addition to verbally having the discussion in class.) I think this year I’m just not being clear enough with my expectations. 

Or maybe I’ll just have students write up good answers at home and hand them in, instead of having them on an exam. And if they aren’t satisfactory, I’ll give students the opportunity to rewrite their answers with my comments incorporated.

Messed up

I messed up. After what I consider a really successful unit in Algebra II on inequalities and quadratics, I was told that I had to introduce students to applications of quadratics. These include revenue problems, maximum area problems, and falling objects problems. I pilfered a list of 10 problems that the Algebra IIA class (the accelerated version of the class) used, and we went through each one of the problems.

Instead of giving a formal assessment on these three types of problems, I gave students a 3 problem “graded homework assignment” — which had two falling object problems and one maximum area problem. I told students they had to work alone, but they could use their notes.

I collected them and graded them, and the grades were atrocious. Almost all of the grades were atrocious. Which leads me to two important conclusions:

1. I really, really messed up teaching these topics.
2. I really, really messed up teaching these topics.

Now I’m not sure what to do. I honestly don’t want to revisit these topics now; we’re making good progress on function transformations and I’m not ready to lose the momentum we’ve gained. I don’t have time to re-teach the topics. And spring break is starting at 3:10pm on Friday.

Blah. The only reasonable solution I feel I have open to me is to:

1. Be direct with my students and accept responsibility for the bad teaching for those days, and have a (short) conversation with them about what made it difficult to follow. (I have a number of ideas, but I want to hear it from the horses’ mouths.)
2. Tell students that I am not going to count this assignment, since I’m taking responsibility for it.
3.  In the fourth quarter, pick one of the application types (I’m leaning to the falling objects one, because the students had the most problems with it), and just focus on teaching it well for one day.

I hate it when I mess up.

Ennui

I don’t really have the energy to give a true update, and I don’t want to complain. I just feel like in the past few days, I’ve been struck with a sense of lingering ennui, and I’m hoping that Spring Break rejuvinates me. It appears that students are really stressed out this week, and it’s being reflected in the way they’re acting. And honestly, it’s a bit of a cycle, because the way the students are feeling is affecting the way I’m feeling, which is affecting the way that students react to me, and so on and so forth.

For short updates on my three preps, read on.

1. In Multivariable Calculus, we’ve been working very slowly on our current chapter. I thought we’d be able to finish it before the quarter ends, but now I’m skeptical. We’re going to have to work pretty darn hard. The current problem set that I’ve given them is pretty tough, but we’re doing this one even more collaboratively than the others, so I’m glad about that. Recently, in class, we had to solve \int \cos^4(x) dx and I forgot how to even go about it. We found a nice, but convoluted solution, because we were working with nice limits of integration. But I have to tell you… I forgot how to do a lot of these less straightforward integrals. The good news is that we came up with ideas and found the solution using symmetry arguments and trig identities. Awesome. At first I feared this was a waste a time, but then I realized: this is what this course is about. Problem solving. You have something you don’t know, and you don’t have a formula for it. Work it out.

2. In Algebra II, I’m a bit behind the other teacher. We’re teaching function transformations, after a pretty arduous — but I’d say successful — unit on inequalities and quadratics. I don’t have a great way to introduce function translations, other than students doing some graphing by hand and noticing some patterns. (“Oh! The graph is the same as the other graph, but moved up one unit!” or “Oh, why is the graph the same as the other one, but moved to the left?”) I’m repressing the name now, but some math blogger posted a Logarithm Bingo game. I think that once I finish the functions transformations unit, I’m going to design and play Function Transformation Bingo!

3. In Calculus, we’ve been working more on the anti-derivative. It’s funny how different my students are. Some have the intuition like *that* while others are struggling to figure out what’s going on. But honestly the only way to do these problems is to really struggle through them. My favorite problem from last night’s homework was to find the antiderivative of x^{1/3}(2-x)^2. Almost all students got it wrong, because they didn’t see that if you expand everything out, the problem reduces to something much easier: finding the antiderivative of 4x^{1/3}-4x^{4/3}+x^{7/3}. Well, them not seeing that it is easily expanded causes me less chagrin than a student saying, “so you must first multiply the x^{1/3} by each term in the 2-x expression, and then square it?” YEARGH!

That’s all folks.

Pendulum Lab, Reprise

This post refers to the pendulum lab I recently posted about. I had my students collect data, and this is what they got:

Length (inches) Period (sec): Group I Period (sec):
Group II
Period (sec):
Group III
Period (sec):
Group IV
60 2.57 2.57 2.49 2.50
54 2.36 2.38 2.34 2.50
48 2.31 2.29 2.17 2.23
42 2.16 2.06 2.03 2.09
36 2.07 1.96 1.86 2.00
30 1.82 1.89 1.77 1.79
24 1.64 1.67 1.64 1.63
18 1.44 1.43 1.42 1.39
12 1.12 1.14 1.12 1.16
6 0.86 0.83 0.87 0.78

The data was pretty consistent among the various groups. Remember we did this lab in the context of parabolas. However, when the groups plotted their results, they were getting:

picture-4

What?! The data doesn’t look quadratic. If anything, it looked to us like a square root or a quadratic with a negative x^2 coefficient. We used our calculators to do a quadratic regression, and got (for one set of data):

picture-5I tricked my class into believing this was a good model. I mean, look at it! The parabola fits the data so well!

But then we looked at the x^2 coefficient and saw it was negative and nearly zero. And then when we expanded our domain, we got:

picture-6

It was at that point that students saw how our model sucked. Because they said that if we increase the length of the pendulum, the period should increase too.

So we went back to the drawing board. I suggested  that we plot period versus length, instead of length versus period. (Next year I’m going to have us discuss this idea more — the swapping of x and y coordinates, and how something that looks like a square root might look like a parabola if we do that. Because of timing issues in this class, I just told them that was what we were going to try. Sigh.)

And we did, and found the quadratic that modeled it, and saw:

picture-7

And then we extended it to see that if we increased our period, if the length would increase too…

picture-8

It does! It makes conceptual sense too! (We also talked about whether it should hit the origin and why our model does or does not hit the origin.)

With our newfound analysis, I had students answer the following question based on their “good” quadratic model (in our case above: y=10.57x^2-4.62x+2.85):

(a) If your pendulum has a period of 1.5 seconds, estimate the length of the pendulum.
(b) If your pendulum  has a period of 20 seconds, estimate the length of the pendulum.
(c) If your pendulum has a length of 10 inches, estimate the period.
(d) If your pendulum has a length of 1,200 inches, estimate the period.

What is nice is that (a) and (b) just involve students plugging in x=1.5 and x=20 into their model. And all the groups got very similar answers for the first length, and really different answers for the second length. So we got to have a short (I wish it could have been longer) discussion of why that is so. (We talked about interpolation versus extrapolation.)

And then (c) and (d) involved students solving a messy, real world quadratic because they’re setting y=10 and y=1200. The same thing that happened in part (a) and part (b) happened in part (c) and part (d); all the groups got very similar answers for the first period, and really different answers for the second period.

What we didn’t get to talk about, unfortunately, is the theoretical answers, based on physics. The formula for the period of a pendulum is T=2\pi\sqrt{\frac{L}{g}} where T, L, and g are in standard metric units. So I was hoping we’d get a chance to do some unit conversions to see how our experimental data relates to to theoretical data.

I did get to show my students how their values compared with the theoretical data:

Length of String Group 1 Group 2 Group 3 Group 4 Theoretical
60 2.57 2.57 2.49 2.50 2.48
54 2.36 2.38 2.34 2.5o 2.35
48 2.31 2.29 2.17 2.23 2.21
42 2.16 2.06 2.03 2.09 2.07
36 2.07 1.96 1.86 2.00 1.92
30 1.82 1.89 1.77 1.79 1.75
24 1.64 1.67 1.64 1.63 1.57
18 1.44 1.43 1.42 1.39 1.36
12 1.12 1.14 1.12 1.16 1.11
6 0.86 0.83 0.87 0.78 0.78

I think they were impressed, though I didn’t get the ooohs and aaahs I was hoping for. I’ve plotted the theoretical (purple) with the actual data (yellow) so you can see how good the experiment was. I am not plotting it on a period versus length graph, though if I were to show my students, I would do that because that’s the way we analyzed the data (we got a parabola).

picture-9

And with that, we finished our lab.