For my first year using Standards Based Grading, I was an SBG-hybrid teacher. The standards that I used made up about 30-40% of students’ overall grades (the category weights changed over the course of the year) and I still included the traditional categories of Tests, Quizzes, Homework etc. This is for two reasons: I was really hesitant to change everything all in one year and I also felt compelled to fit with our departmental grading policy. Next year will probably be the same, almost entirely because of the latter pressure. I got into a little bit of hot water because I didn’t really explain what was doing very clearly at the beginning of the year – anyone else have the same problem?
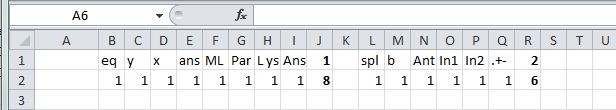
But traditional “summative” assessments can, of course, still provide data you can use to guide your teaching and student learning. When I first started grading tests I would try to eyeball which problem students were getting wrong and then try to remember at the end of grading what skills or concepts they were struggling with. I felt like I definitely would pick out the major ones, but also felt like I was missing a lot. So I brainstormed a way to solve this problem and began grading all of my tests with Excel spreadsheets. Now I see something like this when I grade a test:

That might be a bit hard to see, but basically it’s a breakdown of what percentage of my students got each individual part of each problem correct on a test from this past spring (the actual spreadsheet goes a few more columns over to have the overall score too). I found that this gave me two main benefits:
- Surprisingly faster grading (even with compiling all the data) with less totaling points mistakes
- Extraordinary amount of data about specific parts of test problems that I could use to guide learning and to revise assessments from year to year
–> Example of a completed test grading spreadsheet
So how does this work?
1. The Setup
(this takes me about 10 minutes now, though took longer at first)
- First, I start by placing the breakdown of the points for each question in the second row. This all depends on how you grade tests, but I generally have 6-7 questions on a test that are all broken down into a bunch of individual points for various items like “splitting up the area into a few parts,” “setting up the integral,” “simplifying the expression” and “correct answer.” This forces me to decide beforehand what is important in each problem and how I’m going to grade it. I put little notes above each point for me to remember what each point is for (and again, these force me to award points for specific things rather than a 6/10 for an “almost got it” answer).
 Then, using a summation (this is important), sum up all of the points into a total for the question and place this under the question number.
- Then sum up all of the question totals to make the total number of points on the test.


- Last, using that row you created, fill down as many rows as you need for as many students as you have (plus one row that you can keep at the top to remind you of what each question is worth and the totals). If you use the fill function, the equations that you created in the previous step will stick with you.

Now you’re ready for the actual grading process.


2. The Actual Grading
- Pull out a student test and enter that student’s name in the first column next to their row of points. You can either grade page-by-page/question-by-question or student-by-student, but if you do page-by-page (which I prefer) just keep the tests in the same order. Then, when a student misses something, just enter a 0 in the space for that point. So if Bart correctly identified that the y values are needed in a Riemann Sum as the height of the rectangles, but used the wrong x’s to calculate them, you can leave the 1 in the y column but change the column about the x’s to 0. Notice that it automatically totals how many points he earned both for the question and for the whole test.

Continue doing this until you have graded all the tests. This is the part that I find makes everything faster. The spreadsheet automatically totals everything so you can concentrate on making helpful remarks on the test instead of totaling points.

3. Reflection
(the powerful part)
- Okay, so all of that is nice, but wouldn’t be all that worth it considering hand adding works fine (math teachers = good at mental math). But here’s the powerful part – now with one click of a button, you can see how the whole class did on specific parts of specific problems. Just average the responses for a specific question by averaging the column.

……… - Then fill the equation all the way from the left to the right covering all the individual parts on each question, the question totals themselves and the test total itself. You automatically have averages for everything now.

. - So check this out: The students did overall mediocre-ly (I love making up words) on both questions, but now we can see that they totally understand specific parts on both questions and totally bombed others. I often color code it with the “Conditional Formatting” tool to make this even more visual (only works if everything is out of 1 or you scale everything to be a percent of the total points offered):

. - Now when you go to review, remediate and revisit, you can ignore the green items and focus much more on the reds and oranges. You could even try to judge if the part that NOBODY got right was even a fair question in the first place and use this datum to analyze your assessment.
- You can also use a lot of other Excel features to quickly or do a lot of things like order the students to see grade distribution, curve your test in creative ways if you do that (or see what a bunch of different curves would do), hide the individual points columns to leave the question totals so you can switch between a macro and micro view, and if you input the students’ names in the same order as your gradebook, you can just copy paste right into your gradebook.


I also tend to do a lot of color coding and separate questions by colored bars. This is unnecessary, but makes it easier for me to look at (along with freezing the first column so I can always see the students’ names) Here is my –> example of a completed test grading spreadsheet (same as above).
The Best Part?
One of my favorite things to do though is to compare my data from the Standards to the data from the test. Comparing my formative assessments and my summative assessments. If the Standards are telling me that 92% of the class is rocking the Quotient Rule, but the test problem indicates that only 45% of people can solve a test problem involving the Quotient Rule, what does that mean? Do I need to alter my standards assessments? Was I lulled into a false sense of security by the high marks so I didn’t bother doing any review, or didn’t bother effectively integrating this concept into later material? Did the question I asked on the test line up with the type of thing I had been asking previously, and should it have? Had I been assessing algorithms previously instead of understanding? Lots of grrrrreat questions it raises for me every time.
The Second Best Part
I save all of these files for the next year. This (theoretically) allows me to focus my curriculum revisions on things that weren’t particularly sticky the first time around, and gives me concrete data to compare different approaches used in different classes (if I use some of the same exam questions).
Anyone else do something like this?
from @bowmanimal
