Going into Rational Functions
My impression is that most people introduce rational functions by showing something like…
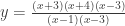
… and then spend the rest of the time asking kids some questions, like “what’s the x-intercept(s)?” “what’s the y-intercepts?” “what’s the vertical asymptotes?” And so from one big equation, you pull out all this individual stuff…
But from what I’ve seen when most kids approach rational equations, it is all very procedural. And every time I dug a little deeper to see what they truly understood about these equations, it became clear that a procedure to “solve” these questions was taking the place of understanding what was going on. So pay attention. You might recognize students don’t know what a hole truly is and why it appears in a graph… or they might not understand why vertical asymptotes appear… at least not on a deep level. The answers I have heard from kids are procedural, and rarely have any deep stuff underneath.
To counter this, I made two major changes to how I approach/introduce rational functions this year.
First, initially, I focus heavily on the graphical side of things. To the point where on the first day, students do not see a single equation, and are asked (entreated!) not to write a single equation down.
Second, I want kids to build up rational functions, instead of breaking them down. I want them to see how they are constructed term by term by term.
So for example, when we see the rational function listed above, we find it easier to view it as:
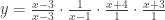
Kids need to understand what the first term is doing — not just “as a rule” but conceptually/graphically. I expect them to say that for any 
Kids need to understand that the second term is creating the function to blow up in a certain way at 
And of course kids need to understand how the third and fourth terms are (graphically) creating x-intercepts in the final graph.
Of course once this is done, you can throw in the other stuff…
Here are my files in .doc form [Rational Fxns 1, Rational Fxns 2, Rational Fxns 3, Rational Fxns 4]
My Awesome Introduction
Although there are definitely ways I can improve this, here is how I started off rational functions. My goal — gentle reader, to remind you — is to do very little explaining and have the kids figure as much out on their own as they can. I felt wildly successful with this when it came to the introductory materials for rational functions.
It took my kids about a class period to do this first packet (they finished the rest up at home). I started with the admonition that no equations should be used and everything needed to be thought of graphically if it was going to be an effective exercise.
Out of this came nice discussions of holes and vertical asymptotes.
For their nightly work on the first day, I had kids finish this packet and then write down all the equations for each of the graphs.
The next day, we went through our answers, and started working on this, which they were crazy adept at doing:
Taking Things Further
I link to a couple more sheets I created above if you want to see what came after… how I introduced end behavior and horizontal asymptotes, and how I introduced graphing.
It wasn’t anything innovative, and could use a lot of work to refine it, but maybe you’ll find something you can work with?
The two things I did like that happened when going over this less basic stuff is:
(1) When kids make sign analyses, they don’t always understand why they are plotting the points they are plotting on the sign analysis. Why do they plot x-intercepts, holes, and vertical asymptotes? I like having my kids discuss why those particular graphical features, and then draw pictures of various graphs where the function does switch from positive to negative (or vice versa) at these points… and have kids draw pictures of various graphs where the function does not switch from positive to negative at these points. Kids, from this, start to understand that if we wanted a sign analysis, these special places (vertical asymptotes, holes, x-intercepts) are places we want to look… and they also start to understand that a function doesn’t necessarily have to change signs at these special places.
(2) I have found in the past that students find it challenging to go from a rational equation to a rational graph, without any scaffolding. So before throwing them in the deep end I like to give them sign analyses and end behaviors, and ask them to sketch a graph that matches the information we know. They start to think of it like a puzzle. Once they have practiced that a few times, they can start doing everything from an equation.
I wish I were less exhausted and could explain more. I literally passed out for a few seconds while typing the end of this post. However, check these lessons out. See if you might want to join me in switching up how we think about rational functions.
Update:
Some questions that you might want to bring up in your study of rational functions…
1. Why do we plot x-intercepts, vertical asymptotes, and holes on the number line when doing a sign analysis?
2. Why do you only have to test one number in each region in a number line… how do we know all the rest of the numbers in that region (when plugged into the equation) will result in the same sign?
3. What is a hole?
4. Why is a hole created? Why does the creation of a hole not affect the “rest” of the equation when it’s graphed?
5. Why do vertical asymptotes appear?
6. Why does the end behavior look like it does?
7. Why can rational function cross a horizontal asymptote and why can it not cross a vertical asymptote?
The key to all of these is why, and if kids can give a procedural answer (e.g. “A hole is created when you see the same factor in the numerator and denominator”) then you know you need to dig more and ask the next question (“so why does having the same factor in the numerator and denominator create a hole?”).

Always admire how thoughtful you (and a lot of other young teacher-bloggers) are about what you’re doing in class. As a very part-time math teacher these days and mostly a math coach, I want to find ways to encourage the frequency and depth of reflection that seems almost routine among the Young Turks and Turkettes whose blogs I try to follow. Would be nice to get some of the folks I coach to read some of those blogs, but very, very few do, sad to say.
Do keep up the great work and the public sharing of it. I despaired of seeing this sort of thing on-line given how much nay-saying was coming out of the Math Wars, but I hadn’t considered blogging and a community of bloggers as a way to simply ignore the incredibly bad energy being purveyed on various discussion lists about math teaching. All I can say is, thanks for what you’re doing.
The first part of your lesson reminded me of this that someone tweeted recently:
http://gdaymath.com/lessons/quadratics5/1-just-do-it/
Maybe not a tight connection, but slightly related and something I found interesting.
As for myself, I find the graphs here hard. I can analyze the functions numerically much more easily than the graphical pieces. That is, I’d rather fill in all the tables first and then graph the results.
I do like the idea of building up the functions rather than breaking them down, though.
Oooh, thanks for sharing that link! I hadn’t seen that.
I like the graphical piece because kids never really learn what the act of multiplying two functions does graphically… Like how can we graphically see relationships between the original functions and the product functions…
Are you saying you want the equations written, and then fill in a table? Or just given a table, and kids fill in the x-y values from the graph, and then use those tables to create a table for the third graph? (Meaning: all these tables would be filled in without equations, only with reference to the x-y coordinates on the graph?)
If so, I have no problem with that. My kids used color pencils and drew a dot on the first graph at x=-3 and saw the y-coordinate… they drew a dot on the second graph at x=-3 and saw the y-coordinate… and then they multiplied those y-coordinates and plotted that on the third graph at x=-3. All but a couple actually were okay with doing that without the tables. Those who needed tables quickly made a quick table!
Ooh I like this. [especially the questions at the end] Your approach reminds me a little bit about how we introduced rational expressions–we also used a pretty graphical approach–but you did the whole breaking the function up thing, which adds another layer of awesome. Filing this one away for next year. :)
Multiplying and dividing graphs – what a terrific idea. Slows the whole process down to allow for more careful analysis. Really nice idea. Tanton (in the link above) talks about choosing interesting x-values when making a graph. Your graphing each separately is a great way to put the focus on what happens around these interesting values.
I do think it is good to look at the equations and do some mental math at some point as well. Without a calculator, I want them to be able to say whether you get a big +, big -, or something close to a particular number when plugging 2.01 into (x -3)/(x-2) or (x-3)(x-2)/(2x-4); or plugging 1,000 into 2x/(x + 1) or (x^2 + 5)/(x + 1) or 2x / (x^2 + 1). Seeing the initial steps in the computation helps to get across the idea of what causes the behavior. To be clear, it is not necessary to actually complete the computation.
Sameer,
I have to admit this is a bit over my head, but I’ve bookmarked it and I’m digging in. That said, I really appreciate your approach here.
I’m working on something called The Puzzle School which is trying to approach education in a similar fashion, but creating environments where students need to figure out the learning, rather than simply being presented with the correct path.
If you get a chance to check it out (http://puzzleschool.com) and find it all interesting, please let me know. I’d love to learn more about how you are approaching things.
Best,
Jared
>My impression is that most people introduce rational functions by showing something like…(rational function omitted)
Not us. We start with the simplest rational function, y=1/x, in grade/year 7, since students that age are learning about negative numbers and are already supposed to know how to graph points and convert fractions into decimals, the three main skills that are required.
Then you can do stuff like this:
http://fivetriangles.blogspot.com/2013/01/42-hyperbola.html
which requires a bit more thinking to solve than the rote determinations of intercepts, holes and asymptotes.
Love. Love. Love.
OK, a couple more thoughts. First, again, I love this. Second, it made me reflect on how I’ve dealt with rational functions in Algebra 1 this year, which has been far more successful than in previous years.
This year I spent a shitload more time and energy on factoring and polynomials work because it became clear to me that students who couldn’t factor a polynomial (and especially a nonmonic quadratic trinomial) stood absolutely no chance of facing down a rational function. So I spent roughly twice as much time on factoring, and about 2/3 as much time on rational expressions and functions. Next year (if there is a next year), I will tie this factoring work to graphing because, as you point out, the linear factors have no relationship to their graphs for most Algebra 2s or Precalc students.
I have noticed that this year’s students are total factoring fiends, so that by the time we arrived at rational functions, they did facepalms and blurted out that OF COURSE these damn things needed to be factored down to prime-ish factors before tey could deal with them and please get outta my way or you’re going to get factored.
I also love (i.e., plan to steal) Five Triangles’ idea of returning to the simplest possible rational function and its graph.
Great stuff!!!
– Elizabeth (@cheesemonkeysf)
Hi Sam:
Excellent work and superb commentators. Here is another thing to consider for assessment purposes; I ask students to invent their own rational functions that meet specific subset of criteria from the following set {domain, range, intercepts, asymptotes, etc.}. I change the subsets from one test to another and sometimes I leave out specific information to purposefully allow for open-endedness in the solution processes. I am hoping to post samples of these questions along with students’ sample answers in my blog during the summer.
Thank you everyone and keep up the great service for our math students.
This is really great! I especially like your introduction. I’ve found that activities like this with opportunities for discussion along with a visual scaffold really engage students. I will definitely share this with the precalc teachers in my district.
Hello Sam:
My colleague Neethi and I (Warren) are Precalculus teachers at the Head Royce school in Oakland CA. Neethi and I collaborate everyday. We were looking at your materials and are planning to incorporate a ton of your ideas (and of course, giving you full credit). Neethi is one of your biggest fans, and I’m jumping on the wagon. I just wanted to say you are an amazing teacher and mathematician. I’ve been teaching since 1993, but Neethi is like you….a pup (meant as a total compliment). Anyway, thanks so much for posting your ideas and work so freely, and openly. We aren’t going to get rich doing this stuff, but we will totally enrich the experience of our students in their learning mathematics. Hope all is well Sam. We will write again soon. And once again, thanks.
Peace,
Warren Fernandes
Head Royce School
Wow, thank you! I actually know of Head Royce because two of my best friends in college went there. You don’t know how great it feels to know someone out there is actually incorporating anything I have to do with in the classroom!!! Last year was my first year with precalculus, so if you have any ideas on good things for me to do, please let me know!
Always,
Sam
Hey Sam:
I might have actually taught your friends (I’m assuming they were at MIT). What are their names? I also teach BC Calculus, so more than likely, I ended up teaching them at Head Royce. And Neethi and I will most definitely let you know of our ideas. As of now, mine are simply not as good and valuable as yours, but Neethi always impresses me with new ideas. Neethi and I are collaborating for the first time, and we are truly attempting to have our students discover the ideas of PreCalc, as opposed to us lecturing on them. It’s such a different mindset, but some kids simply want to be told what to do. If last year was indeed your first year teaching PreCalc, then I’m even more impressed. Neethi doesn’t know I emailed you. She is going to scream when she sees you responded. You really are someone she admires (as do I). We spent about 3 hours looking at your documents Friday night. Yeah, I know, we’re crazy…doing math on a Friday night. But then again, that’s why we love doing what we do, right? Anyways, sleep well my friend. And have a great school day tomorrow. My 4 1/2 year old (Skylar) says its time for books and bed. I think she’s right.
Peace,
Warren
Had this starred from awhile back. Love how you develop the concept, Sam.
Can you post an answer key for these worksheets!
Did you find an answer key for these?
Thank you! My students showed great understanding after this lesson. Thanks for sharing.
Yay!
Thank you so much for your insights! I’m actually a college student majoring in Mathematics teaching. Your suggestions may make my class (in the future, when I graduate) more lively and fun, yet the learning and understanding are deeper. I’m really interested in new approaches to teaching these concepts. Please continue to blog your lessons. More power. Cheers–
How might you change this with the use of Chrome books in the classroom?
It’s a good question, but one I am afraid I have no way to answer. We do have laptops (not Chrome Books), but I rarely use them. And for this approach to rational functions, there is something very important about doing a lot of graphing by hand (point by point). Sorry I don’t have a better response. :(
I’m excited to have stumbled across your blog today! I was looking for ways to make more sense of rational functions for my algebra II students, and this post popped up on google. Very unique approach! Unfortunately, I’m running short on time this year, but I plan to revisit these ideas for next year. Have you thought about sharing some of your content on TeachersPayTeachers?? I think teachers could really benefit from your ideas!
Thanks again!
-Brittany Kiser
Hi Brittany,
Wow, thanks for your compliment! This work on rational functions is one of my favorite teaching creations! It works really well for my kids.
I have a lot of reasons why I don’t share my work on TpTs, but fundamentally I like seeing myself as part of a math teacher community that values free sharing of resources, ideas, and help! TeachersSupportingTeachers! In case you don’t know about it, this search engine indexes a lot of the math teacher blogs and can get you great resources easily! http://www.fishing4tech.com/mtbos.html
And if you don’t know about the awesome online math teacher community and some of the cool stuff that exists, here is a good place to peruse: http://mathtwitterblogosphere.weebly.com/cool-things-weve-done-together.html
Always,
Sam
This approach worked out fantastically!! I especially loved the idea of “building” the function: Starting with a line or parabola, adding a hole, etc. So nice! My students were amazed by the curves they could get by manipulating the rule of the function. It was the first time I felt that students felt IN CONTROL of the function, rather than the opposite way around.
It was the 5th time I teach rational functions in high school, and my method was just not working the way I would have liked! The opening sentence to this post is SO true! That’s how I was approaching it. Your ideas and approach were just amazing. I used all your worksheets with only tiny, very minor edits to suit my class, and they loved it. This is the first time I have the impression that my students actually enjoy and are not afraid of rational functions.
Thank you so much for providing this resource. You’re very generous and clearly passionate about this!
By the way, the software Graphmatica (free download, and it stays even though they say it’s a limited offer) shows holes, it’s great.
Wow! Thank you so much for sharing! And I will look into Graphmatica!
Who invented rational functions
I have no idea about the history of rational functions. But if you find out, please let me know!
just discovered this as I prepared to teach rational functions for the first time in honors precalc. This activity was amazing. I made some changes to include limit notation when we discuss end behavior, but so far they are definitely feeling comfortable. So excited to start sketching tomorrow.
Hi! Thank you so much for letting me know that it worked. Yes, this is perfect to start giving a sense of limit notation!
Any chance you would send these file for free? I don’t have a scrbd account. Thanks!
Near the beginning of the post are all the word docs posted! So you can just download them and modify!
Ah thank you!!!!
1. This is the best post I have seen about rational functions. I LOVE the idea of breaking up the function into separate fractions, and making meaning of each one.
2. Question: True or false: with sign analysis, the only way that a hole could “mark” a sign switch (in the y-values) is if that hole is on the x-axis (i.e. like an x-intercept, but it’s a hole).
[I think the answer to my question is “true” but would love some affirmation :)
1. Thanks so much!
2. True!
Thank you so much for posting this! I was looking for ways to challenge my incredibly bright, but procedure-reliant precalculus students and it worked!!! What a great idea! I must say that the few times someone has encouraged me to teach concepts “backwards,” it has results in the most amazing lessons and much deeper understanding by students. Keep it up! And, again, thank you!
I really appreciate you taking the time to share this with me. Seriously, you made my day!
Thank you for sharing this activity. I had some reluctant students attempt to find the functions and just find the function h(x).
Although I appreciate them using skills they’ve learned thus far, its really important for them to see the results of multiplying and dividing polynomials. This also lead to very good discussions on holes and asymptotes.
I am having some trouble finding the function for f(x) in problem 5 Rational Functions #1.
Since there are 4 turning points I would expect my function to have at least a degree of 5. And since the end behaviors are distinct, I know that it will have an odd degree for the highest degree. After that, I am kindof stuck.
Hi AlexMora,
I have to run to school, but the short answer is no equations should be used to come up with the final graph in “Rational Functions #1.” I wrote in the post:
>>It took my kids about a class period to do this first packet (they finished the rest up at home). I started with the admonition that no equations should be used and everything needed to be thought of graphically if it was going to be an effective exercise.<<
The whole idea is to have them not get the complexities of the equations tied in with the simple idea of multiplying and dividing functions. So no need to have an equation! Just multiply the y-coordinates from the first graph by the y-coordinates of the second graph!
Always,
Sam
Loved the lesson, I’ve spent two days with rational functions. I have not given any direct instruction but students are using vocabulary words to describe holes in the graphs and its amazing.
I spent two days on the first worksheet you created and my Algebra 2 students (non pre-ap students) and they are discussing holes and end behavior of functions they are graphing.
I am lookng forward to working with VA and HA asymptotes. It’s going to be life changing!
Thanks