Month: July 2008

Polar form of Laplace’s Equation

As you might know, this summer I’m prepping for the multivariable calculus course I’m teaching next year. When going through the textbook, I’m attempting some of the “challenging” problems near the end of the section.

Today, when refreshing myself with the chain rule, I came across a problem which tested my intuition. And I’m afraid I’ve lost what little intuitive mojo I had years ago. I’m going to reproduce the problem below.

Question:

Suppose that the equation z=f(x,y) is expressed in the polar form z=g(r,\theta) by making the substitution x=r \cos \theta and y=r\sin \theta.

  1. View r and \theta as functions of x and y and use implicit differentiation to show that:
    \frac{\partial r}{\partial x}=\cos\theta
    \frac{\partial \theta}{\partial x}=-\frac{\sin\theta}{r}
  2. View r and \theta as functions of x and y and use implicit differentiation to show that:
    \frac{\partial r}{\partial y}=\sin\theta
    \frac{\partial \theta}{\partial y}=\frac{\cos\theta}{r}
  3. Use the results in parts (1) and (2) to show that:
    \frac{\partial z}{\partial x}=\frac{\partial z}{\partial r}\cos \theta-\frac{1}{r}\frac{\partial z}{\partial \theta}\sin\theta
    \frac{\partial z}{\partial y}=\frac{\partial z}{\partial r}\cos \theta+\frac{1}{r}\frac{\partial z}{\partial \theta}\cos\theta
  4. Use the results in part (3) to show that:
    (\frac{\partial z}{\partial x})^2+(\frac{\partial z}{\partial y})^2=(\frac{\partial z}{\partial r})^2+\frac{1}{r^2}(\frac{\partial z}{\partial \theta})^2
  5.  Use the result in part (4) to show that if z=f(x,y) satisfies Laplace’s equation
    \frac{\partial^2 z}{\partial x^2}+\frac{\partial^2 z}{\partial y^2}=0
    then  z=g(r,\theta) satisfies the equation
    \frac{\partial^2 z}{\partial r^2}+\frac{1}{r^2}\frac{\partial^2 z}{\partial \theta^2}+\frac{1}{r}\frac{\partial z}{\partial r}=0
    and conversley. The latter equation is called the polar form of Laplace’s equation.
Here’s my issue. I can do parts (3)-(5) fine. But I got stumped for a good 15 minutes on the parts (1) and (2) and I’m sad about it.
So my lament is: wow, I suck.
And my question is: is there an easier way to solve this?
My solution is the following:
We know y=r\sin\theta, so differentiating with respect to x we get
(1) 0=\frac{\partial r}{\partial x}\sin\theta+\frac{\partial \theta}{\partial x}r\cos\theta
We know x=r\cos\theta, so differentiation with respect to x we get
(2) 1=\frac{\partial r}{\partial x}\cos \theta-\frac{\partial \theta}{\partial x}r\sin\theta
We now have a system of two equations, which we can solve for \frac{\partial r}{\partial x} and \frac{\partial \theta}{\partial x}. Going through the motion yields the right answer.
So yeah, looking back, its all makes sense. And I feel sheepish for posting this, because this is pretty easy to do. But it doesn’t seem simple. There is a part which calls for intuition: to know that we have to get two equations and then solve them together. I’m guessing there’s an easier way to do this, that doesn’t involve solving a system of equations. Is there?

Flatland, the movie, staring Veronica Mars and President Bartlett

How the heck in the n-dimensional universe did I miss this? I need to get on this, STAT!

I read the book a long time ago, but I remember it being about gender in the Victorian era. And math, of course. Am I totally wrong about this?

Earthquakes, Richter Scale, and Logarithms

Today there was an Earthquake in Southern California. A NYT article said:

The quake, estimated at 5.4 magnitude (reduced from an initial estimate of 5.8), was centered 35 east of downtown Los Angeles in Chino Hills, just south of Pomona in San Bernardino county. It was felt as far east as Las Vegas and as far south as San Diego.

My first reaction, a question: how much of a difference was there in terms of the seismic energy released at the epicenter of the estimated earthquake versus the actual earthquake? How off was the esimate? I know that the Richter Scale is logarithmic, so the answer would be:

\frac{Magnitude_{Estimated}}{Magnitude_{Actual}}=\frac{10^{5.8}}{10^{5.4}}=10^{0.4}=2.51

The estimate was over 2.5 times off.

But I realized: I know very little about the Richter Scale and how earthquakes are actually measured. How could an initial estimate be so wrong? I’m going to use this post to explain what little I’ve pieced together from the internet.

Jump on below!

(more…)

Integration as Accumulation

I was downloading something yesterday and noticed that my downloading program tells me the download speed, and it updates it every half second or so. It also tells me how much of the file I’ve downloaded, total (e.g. 29.6 MB out of 64 MB, 46.3% completed).

This is a perfect example of integration as accumulation! The integral gives you the total amount of the file the program has downloaded. The graph above — created by a bittorrent program called \mu-torrent — creates a graph of the download speed over time. [1]

This actually would be a great way to have students come up with the conceptual idea of Riemann sums themselves: given a thousand data points, collected every half-second, of the download speed, what would be a good way to figure out how much has been downloaded. How would you estimate it?

And you could extend it to say: if you wanted a quicker but less accurate way to come up with how much has been downloaded, how would you do that? Students might say, “take every fifth data point” or “average every five data points” or come up with some other interesting method!

Or you could ask if there is a more accurate way to come up with how much has been downloaded. And there’s a good chance, with some requisite prompting and asking the right questions, that they could come up with the Trapezoidal Rule. And then you could segue into Simpson’s Rule.

Note: I know, I know, you could do the same thing with a speed v. time graph (giving you distance), or any other number of graphs. But I like this. It comes naturally out of things we do everyday!

[1] I cribbed this from here.

Frictionless, Massless Problem from Hell!

My sister told me this physics problem, and I have no idea how to solve it. It goes like this. There are two identical balls, one lying a distance x from the edge of a frictionless table, and the other being held up in the air, a distance x from the edge of the table. (See diagram above.) They are connected by a massless rope.

At time t=0, the ball hanging in the air is dropped.

Do you see what’s going to happen? That ball will start to fall down and approach the table, while the ball sitting on the frictionless table will be pulled toward the edge.

Two questions, both of which I can’t answer:

(1) Which will reach the vertical plane of the edge of the table first? (In other words, will the ball on the frictionless table fall off the table before the falling ball hits the side of the table? Or vice versa? See my diagram below to see what the estimated path of the falling ball will look like. It curves towards the table, but also the distance from the corner of the table to the falling ball will increase as more time passes.)

(2) What is the equation for the path of the falling ball? (Again, see diagram below.)

Handshakes among justices

It seems I was scooped.

In my ongoing obsession with the law and math (see post I and post II here), I learned that for many years, all the supreme court justices shake hands before each meeting.

The “Conference handshake” has been a tradition since the days of Chief Justice Melville W. Fuller in the late 19th century. When the Justices assemble to go on the Bench each day and at the beginning of the private conferences at which they discuss decisions, each Justice shakes hands with each of the other eight. Chief Justice Fuller instituted the practice as a reminder that difference of opinion on the Court did not preclude overall harmony of purpose. (here)

It still goes on today. There are 9 justices. A natural question: how many handshakes?

The “handshake problem” is a common problem in math classes. It’s equivalent to the problem of calculating the number of diagonals of a polygon. (Each vertex is a person; each line — including the edges of the polygon itself — represents a handshake.) It’s equivalent to adding the numbers 1+2+...+(n-1).

I was thinking it would be a good hook for a class where this problem was presented. Better than:

Assume we have n people at a dinner party who all don’t know each other. They all introduce themselves to (yawn) each other… (yawn)… and shake hands. How many (yawn) handshakes are there?

In the same sense that that’s not a true-to-life problem, neither is the supreme court handshake problem. But it’s a hook.

Of course, I looked it up to see if anyone else had thought of it (likely) and guess what? As I said: I was scooped.

Was it Scholarly Research or Advertising in Disguise? The Cost-Analysis of Science Journals

I was so enthralled with Judge Sand’s city of Yonkers case that I couldn’t help but do a little more research on him. And lo and behold, nary a page in from a google search, I found another case that deals with math!

The setup

Henry Barschall, working for the American Physical Society and the American Institute of Physics, investigated the cost of science journal subscriptions for libraries. Even then in 1986 (as we hear is still the case now), science journals were increasing their prices — for a variety of reasons. And science journals were on average more expensive than journals in other disciplines (e.g. in 1985, the average yearly subscription for a science journal was $328, while for philosophy, it was only $47 — here).

The survey was done and ready to be published in Physics Today. Barschall outlined his methodology here. The intial results which were published in 1986 are below:

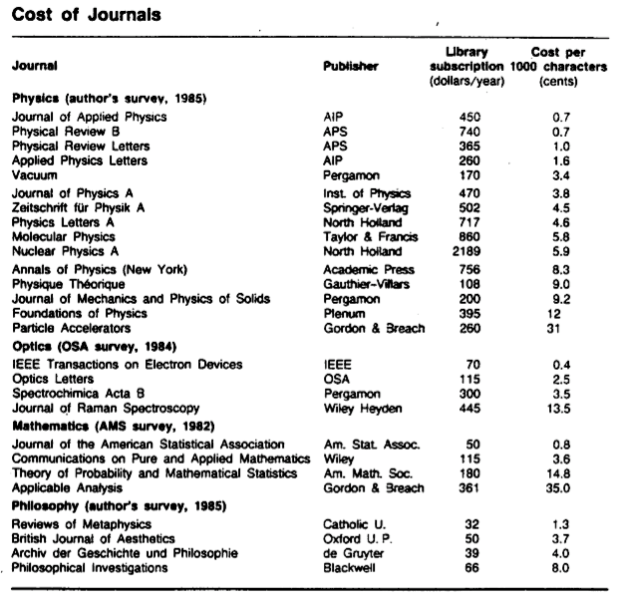
Note that for the physics journals, the American Physical Society and the American Institute of Physics were the most cost effective (0.7 cents/1000 characters), while Gordon and Breach were the least cost effective (31 cents/1000 characters). For this case, it’s important to note who sponsored the study! (The same organizations who came out the “winners.”)

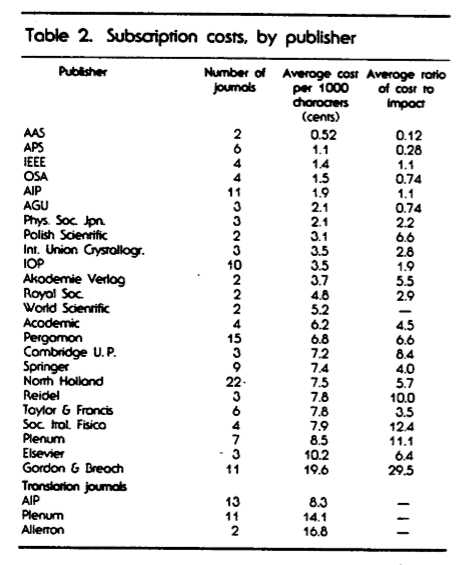
An expanded survey, published in 1988, took into account not only the price, but the “impact” (or importance) of the journal… The metric for the impact was the average number of papers which cited an article in the journal two years after its publication. The more “impact” the journal had, according to the study, the more it mitigated a higher cost (hence: a ratio was created).

Again, APS and AIP were near the top of the list, while Gordon and Breach were way down at the bottom, with a cost/impact ratio more than twice the next publisher.

Gordon and Breach sued the APS and AIP. Judge Leonard Sand heard the case, and summarized it as follows:

This action, a dispute between publishers of scientific journals, raises an issue of first impression: whether a non-profit publisher may be sued for false advertising under the Lanham Act for publishing comparative surveys of scientific journals which, through the employment of a misleading rating system, rate its own publications as superior.

[…]

These articles, G&B alleges, constituted the start of a “continuous promotional campaign” waged by AIP and APS against them with the aid of Barschall’s survey results. First, G&B alleges, AIP and APS distributed “preprints” of the 1988 survey results to librarians (the primary purchasers of scientific journals) at a conference in June 1988. Since that time, G&B alleges, defendants have continued to disseminate the results of Barschall’s surveys to prospective purchasers through press releases, letters to the editor, “electronic mailings,” and meetings with librarians (“secondary uses” of the articles). G&B states that its attempts to reach an accommodation with defendants have been fruitless, and that it has been forced to resort to the courts. After filing a series of legal actions in Europe claiming unfair competition, and failing to receive satisfaction in Swiss, German, and French courts, G&B brought this lawsuit in September 1993.

G&B contends that the articles are promotional materials cloaked in the deceptive guise of “neutral” academic inquiry, and thus constitute misleading advertising under the Lanham Act, 15 U.S.C. § 1125(a), and comparable provisions of New York General Business Law. Barschall’s studies, G&B contends, far from being neutral, in fact constitute a “cynical promotional campaign” by AIP and APS to deceive librarians and other consumers of scientific journals into thinking that their journals have been “scientifically” proven to be of superior value.

Judge Sand’s judicial opinions, the trial transcript (really interesting stuff! I swear!), Barchall’s papers, and other related material have been put on this site at Stanford for you to read.

Eventually in 1997 (yes, justice takes a long time to render), Judge Sand made his final ruling:

Barschall’s methodology has been demonstrated to establish reliably precisely the proposition for which defendants cited it — that defendants’ physics journals, as measured by cost per character and by cost per character divided by impact factor, are substantially more cost-effective than those published by plaintiffs. Plaintiffs have proved only the unremarkable proposition that a librarian would be ill-advised to rely on Barschall’s study to the exclusion of all other considerations in making purchasing decisions. This consideration in no way makes Barschall’s study or defendants’ descriptions thereof false, and accordingly judgment is granted to defendants.

And the case is over!

Could this be useful in a math class?

I don’t know. I honestly can’t see myself using it next year, except maybe for a quick classroom discussion — a few “do nows” where each day I introduce more and more of the case and the evidence, and we talk about the math issues it raises…

  1. Before presenting the data, it could lead to a discussion of how one might measure the cost-effectiveness of journals, and different ways students could imagine calculating them.
  2. Does Barschall’s method of measuring impact make sense? Does taking a ratio of cost per thousand characters to impact work? Why divide? (That will be hard for my students to get.)
  3. A baby project: students could go to the school library and get data about various online databases that the library subscribes to, and try to determine whether subscribing is cost-effective for the school. Or at least, the class could try to brainstorm out what sorts of data we would want (e.g. the cost of the database annually, whether — and if so, how quickly — the cost of the database has been increasing, the number of times the databases are accessed each day, the amount of information the databases contain, etc.)But honestly, this seems like it isn’t really worth it. It would make for an interesting independent study, though.
  4. A discussion about whether the survey was ethical or not, merely by virtue of the fact that those producing it were players in the game (non-profit players, but players none-the-less). [A similar discussion would be whether drug companies should produce their own studies of drug effectiveness.]
  5. Ideas for how one might present the data visually?
  6. Should a court (even with scientific experts being called in) be the final arbiter in whether a mathematical study/survey was sound or not? If not, who should be?
But besides being interesting, do you see a good use for it in the classroom? If you do, leave a comment with an idea!