Today there was an Earthquake in Southern California. A NYT article said:
The quake, estimated at 5.4 magnitude (reduced from an initial estimate of 5.8), was centered 35 east of downtown Los Angeles in Chino Hills, just south of Pomona in San Bernardino county. It was felt as far east as Las Vegas and as far south as San Diego.
My first reaction, a question: how much of a difference was there in terms of the seismic energy released at the epicenter of the estimated earthquake versus the actual earthquake? How off was the esimate? I know that the Richter Scale is logarithmic, so the answer would be:

The estimate was over 2.5 times off.
But I realized: I know very little about the Richter Scale and how earthquakes are actually measured. How could an initial estimate be so wrong? I’m going to use this post to explain what little I’ve pieced together from the internet.
Jump on below!
Measuring Earthquakes: A Basic Tutorial
As you probably know, earthquakes are measured from seismometers, which measure vibrations in the ground. They’re pretty much just fancier versions of a pen hanging by a string from a pole stuck in the ground, drawing a line on a constantly rolling piece of ticker tape. So if there are no vibrations, you’ll get a straight line. If a truck drives by, there might be a jiggle.

Of course, professional seismometers are more sophisticated — and can detect the smallest vibrations. They also know how to take into account urban disturbances (ahem, like ice-cream trucks passing by).
A seismometer produces a seismogram, which is what gets recorded on the ticker tape. It might look like this:
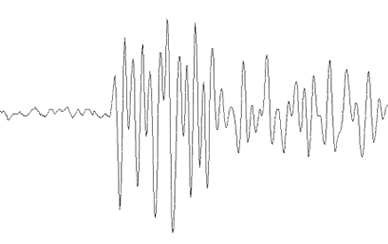
Now here’s where the work comes in. We have to use this crazy bunch of squiggles to get a single “magnitude” for the earthquake. And the magnitude should be the same, no matter where the seismometer is — whether it is near the epicenter of the earthquake, or miles away from the epicenter.
Here’s where we get a break. Earthquakes start at an epicenter and the waves travel radially outward. The good news (well, good for us mathematical explorers) is that two types of waves occur, and they travel at different speeds. First there are compressional waves (called P-waves) which travel radially outward — compressing the earth along the Earth’s surface. Then there are shear waves (called S-waves) which causes actual shake-y waves — perpendicular to the Earth’s surface. See the diagram below:
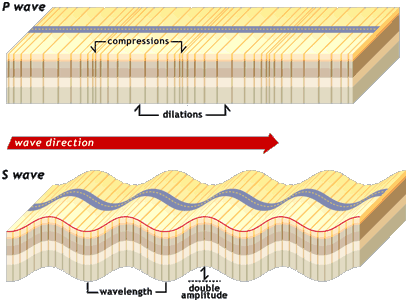
Another way to think of the two types of waves is through a slinky. P-waves are what happens when two people are holding a slinky taut, and one person compresses it a little bit and lets go… The “compression” travels from one end to the other. S-waves are what happens when two people are holding a slinky taut, and one person quickly moves their hand up and down. The up and down motion creates an up-and-down wave which travels through the slinky, from one end to the other.
[In the video, the transverse wave is the S-wave and the longitudinal wave is the P-wave]
As I said, lucky for us, the two waves don’t travel at the same speed through the earth… The P-waves travel faster than the S-waves, so we see them on the seismogram first!

Since the two waves travel at different speeds, we can use the time difference for them to reach the seismometer to act as a metric for the distance from the epicenter (in the diagram above, it is labeled the S-P time interval). If the difference were 0, then we’d be at the epicenter. If the time difference were really large, we’d be really far from the epicenter.
The other factor we need to include in an equation for the magnitude of the earthquake is the “height” (amplitude) of the lines on the seismogram. If we were measuring the earthquake at the epicenter, the higher the lines, obviously the “worse” the earthquake. In fact, the equation for the Richter scale uses the measure of the highest point on the seismogram (the distance in millimeters from the straight line that would be created if there was no earthquake).
The formula originally used by Richter (from this webpage) is:


(Where 
Because of all the different seismograms from a number of stations, the estimates will differ based on varying data. We wanted to know — prompted by the NYT article — why they differ.
Seismologists will try to get a separate magnitude estimate from every seismograph station that records the earthquake, and then average them. This accounts for the usual spread of around 0.2 magnitude units that you see reported from different seismological labs right after an earthquake. Each lab is averaging in different stations that they have access to. It may be several days before different organizations will come to a consensus on what was the best magnitude estimate. (from here)
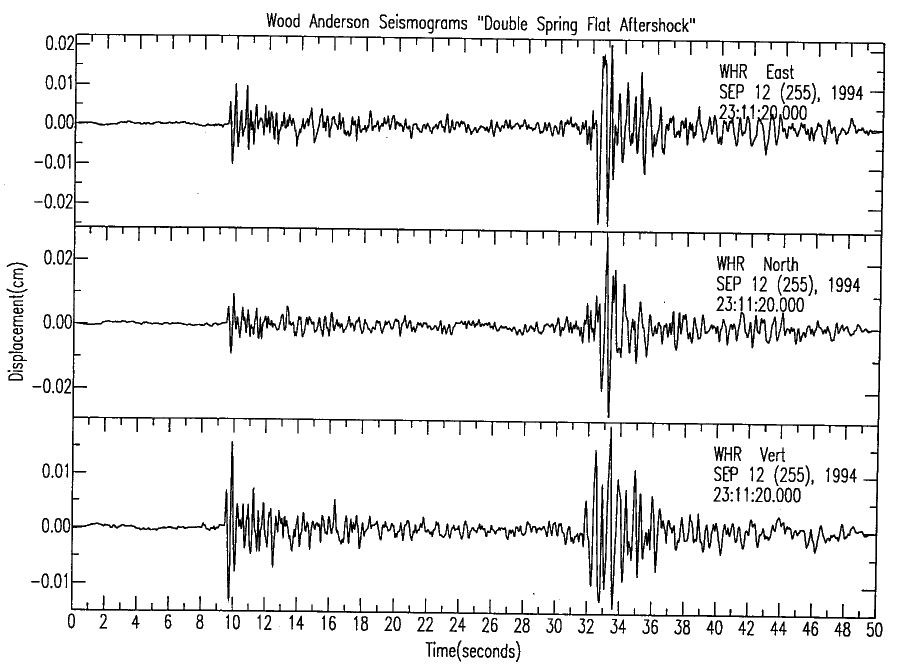
Some graphs of an earthquake various distances from the epicenter. Can you tell where the P-waves start, where the S-waves start, and which graphs are from seismometers far away from the epicenter and which graphs are from seismometers near the epicenter? (Graphs from here.)


Today’s Quake
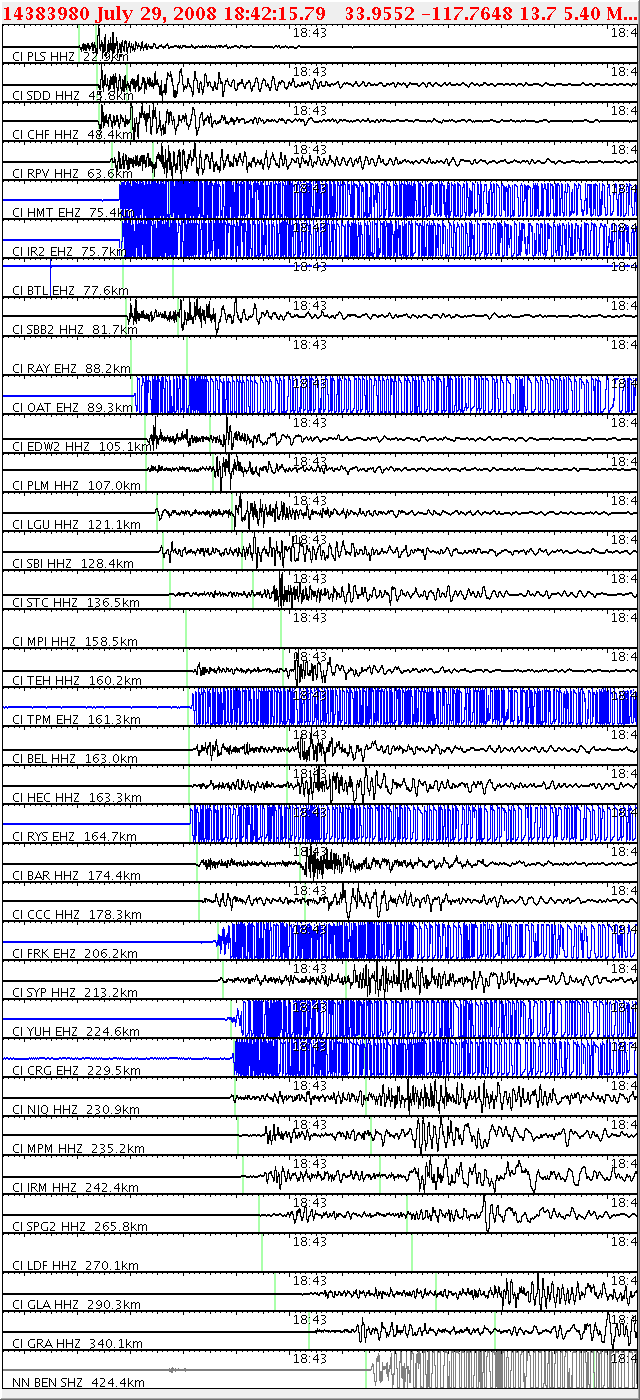
More timely, you can see the seismograms used to calculate today’s 5.4 magnitude earthquake below (from the USGS, here). (Be sure to ignore the graphs in blue — those aren’t seismograms.) Here are a variety of seismograms from various places in California at the time of today’s earthquake, and the onset of P and S waves are marked by vertical green lines. As expected, you’ll notice that the further away the lines are from each other, the farther away the seismometer was from the epicenter. (The distance from the epicenter is labeled on the seismogram.)
And although we’ve gone through all this rigamarole, I have some bad news. In fact, the Richter Scale breaks down for very large seismic events, and a newer calculation has become more standard: the Moment Magnitude Scale (and the wikipedia article).
PS. Even though today’s earthquake was estimated to be 2.5 times the magnitude of the actual earthquake, the Richter Scale isn’t the metric you want to use for the destructiveness of an earthquake. What you want to find is the strength of the earthquake… and that is measured by intensity (not magnitude). Read up more here.
Good Teaching Tools:
(1) USGS lesson on comparing two earthquakes
(2) Use this interactive applet to see if you can’t figure out the magnitude of four famous earthquakes using seismograms.
(3) Virtual Courseware on earthquakes. The Epicenter-Magnitude activity is amazing. If you can complete that, you definitely have mastered how an earthquake’s epicenter and magnitude is computed from a bunch of different seismograms from a number of different locations.

How the Richter scale is tied to logs?
Thought it was interesting that you just stumbled upon my blog; then, while researching about earthquake magnitudes (because we just had a minor one just a several minutes ago, and my Algebra II is currently learning about logarithms), I happen to find myself learning about earthquakes from your blog.
Anyway, thanks for the “hi” and for the earthquake information. :)
JT
u have dimples!!
#destiny
@Justin: How entirely random! And awesome.
Great, easy-to-understand explanations, even for an English major. I’m now an artist an am interested in incorporating something Richter-scale like in some new paintings, so I came upon your site. Wish you had been my math teacher so many years ago,
Thanks,
Suzanne
That is very sweet of you Suzanne!!! I’m interested in hearing more about your painting with something Richter-scale like? You might want to do a google search on “log scale” and “log log scale” to see some cool ways that standard space can be transformed.
You can definitely see your expertise in the work you write. The arena hopes for more passionate writers such as you who aren’t afraid to say how they believe. Always follow your heart.
richter scale’s details are not at all enough for me……………
thank you for all your information