Month: January 2009

WebAssign: A Quick Question

I was reading Teaching College Math and came across a glowing review of WebAssign. (Her great powerpoint here.) Wow! Math help websites have come a long, long way! I was wondering if anyone out there uses it, and if so, what the pros and cons of it are? Are your students satisfied with it, or do they complain about how it works?

Why I’m acute to this: In grad school, I took a few undergrad French and German classes, and we had web assignments too. Unfortunately, although a great idea in theory, those assignments were a nightmare in practice. Missing letters, a different way to say things, a forgotten umlaut or accent, an extra space, etc., would render an entire question wrong. Or you could be completely correct, and you’d still be marked wrong. Everyone hated it. I want to make sure that WebAssign doesn’t have those sorts of annoying bugs. I want to make sure if you write y=\frac{x-1}{2x-1}, it would be marked the same as if you had written y=\frac{1-x}{1-2x}.

Movies about Mathematics

I asked my department head if we had a budget for DVDs, so that we could start creating a small DVD library for us to use (in class, in mathclub). She said yes, and put me in charge of finding DVDs. I’ve ordered a bunch, but tonight, I came across 0ne more that I want so dearly that I wrote an email pleading to case get the $35 to purchase it!

*****


Julia Robinson and Hilbert’s Tenth Problem

*****

Other DVDs that we’ve ordered and that I’m excited about include:

*****


Hard Problems (two youtube clips from the movie: clip 1, clip 2)

*****


Chaos (a series of  24 lectures, 30 minutes each, from the Teaching Company)

*****


N is a Number: A Portrait of Paul Erdos (on youtube: part 1, part 2, part 3, part 4, part 5, part 6)

*****


The Elegant Universe (on String Theory)

*****

I also got the old classics: Stand and Deliver, Good Will Hunting, and A Beautiful Mind.

And I will also soon be downloading this movie on various Dimensions.

I wish that NOVA’s The Proof (about Andrew Wiles solving Fermat’s Last Theorem) was out on DVD, but alas, no such luck. It is on VHS and on youtube (part 1, part 2, part 3, part 4, part 5).

I haven’t watched Dangerous Knowledge — a documentary on Cantor, Boltzmann, Godel, and Turing — yet (I don’t like the trope of mathematician as crazed genius), but it’s on youtube here: part 1, part 2, part 3, part 4, part 5, part 6, part 7, part 8, and part 9 and on Google Video here.

And finally, I wanted to show my Algebra II class something about fractals tomorrow, since we introduced complex numbers today. I didn’t do much searching, but I did find Arthur C. Clark’s movie on Fractals, which — sans the annoyingly trippy music — doesn’t seem too bad: part 1, part 2, part 3, part 4. It isn’t very up-to-date, but it does have a lot of famous people talking about fractals.

Any more recommendations? Throw ’em in the comments below.

Is it bad that…

I’m already counting the days until Spring Break? In the last few days before winter break ended, I’ve been inspired to start on some teaching projects… but I didn’t because I know I won’t have the time to finish them. I should have started them earlier in break. This always happens to me, where I initially want to be a complete schlump for break and then regret it in a fit of flurry at the end. Here’s what I didn’t do, that I hoped to do.

1. Create a project and rubric where calculus students video an object changing position over time (and velocity over time), and then analyze it using LoggerPro.

2. Create a topological project for my multivariable calculus students.

3. Come up with a revised, scaled back video project for my Algebra II students, like last year’s project.

4. Think about a string hanging from the ceiling of a classroom, creating a pendulum like Foucault’s Pendulum. I would give it a start and watch it trace out some crazy spirographic curves. I wonder how these curves connect up with polar coordinates/polar equations. I don’t want to look it up, but instead explore and think about it myself. (I don’t want to use it to study the motion of the earth.) Maybe expand my study to harmonographs and lissajous curves. Could be good for mathclub.

5. Think about creating a second semester class blog for my Alg II class, like this one here. I really like the idea of students having to communicate what they learned for others to refer to. It’s valuable (if done well) on so many levels.

6. Compile all the class data from this linear regression sheet to make one giant data set for us to look at together. I really dropped the ball on this — I wanted to do it but never had the time/motivation to enter all the data in an Excel sheet. I should have had students all enter it in a Google Spreadsheet. Sigh.

7. Start working on making an interesting 3 day calculus midterm review.

Yeah, it’s pretty bad that I didn’t do any of that. Sigh.

Venn Diagrams and Formulas

At the math office today, two math teachers were discussing probability. Two things were surprising about it. One, it was a Saturday afternoon part of our winter break, so no teachers should have been on campus. (We’re a dedicated lot, us math teachers.) Two, the topic they were discussing was so simple, and yet, it reveals the real mind-bending character that probability has on us and our students.

Question 1: What is the probability that you draw a heart or a queen from a deck of cards?
Question 2: What is the probability that you roll a die and get a number less than 4 or an odd number?

Both questions are simple enough. The first one is 16/52 (because there are 16 cards which are hearts or queens in a deck). The second one is 4/6 (because you can roll a 1, 2, 3, or 5).

The problems are seemingly the same. Let’s now look at this problem from the perspective of a venn diagram.
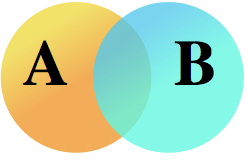
picture-1If we want to know the probability that event A or event B occurs, we clearly can see that we have:

P(A\text{ or }B)=P(A)+P(B)-P(A \text{ and } B)

(We have to subtract that last term, because we added that overlapping section twice when we took P(A)+P(B).)

Let’s apply that to our two questions:

Question 1: We have a probability of: P(\text{Heart or Queen})=P(\text{Heart})+P(\text{Queen})-P(\text{Heart and Queen}). Clearly P(\text{Heart})=13/52 and P(\text{Queen})=4/52. What is P(\text{Heart and Queen})? Intuitively — or using our venn diagram — we know it is 1/52. And the answer works out correctly to 16/52.

Question 2: We have a probability of:  P(\text{less than 4 or odd number})=P(\text{less than 4})+P(\text{odd number})-P(\text{less than 4 and odd number}). Clearly P(\text{less than 4})=3/6 and P(\text{odd number})=3/6. What is P(\text{less than 4 and odd number})? Intuitively — or using our venn diagrams — we know it is 2/6. And the answer works out correctly to 4/6.

However, let’s say we wanted to calculate P(\text{Heart and Queen}) and P(\text{less than 4 and odd number}) (the overlapping regions) mathematically? It turns out that there is something fundamental that makes these two problems different. In question 1, the two events (drawing a heart / drawing a queen) are independent. In question 2, the two events (rolling a number less than 4 / rolling an odd number) are dependent. For the first question, you can say that P(\text{Heart and Queen})=P(\text{Heart})P(\text{Queen}) while in the second problem you cannot do that.

Recall that the definition of independence of two events A and B is if P(A|B)=P(A).

Checking the first question for independence, we see that the probability of drawing a heart given that you already have a queen is 1/4, and that is the same as the probability of drawing a heart (1/4). (Similarly, the probability of drawing a queen given that you already have a heart is 1/13, and that is the same as the probability of drawing a queen (1/13).) So the two events are independent.

Checking the second question for independence, we see that the probability of rolling and odd number given that you have rolled a number less than 4 is 2/3, while the probability of rolling an odd number is 1/2. (Similarly, the probability of rolling a number less than 4 given that you’ve rolled an odd number is 2/3, while the probability of rolling a number less than 4 is 1/2.) So the two events are dependent.

The teacher who brought up this problem was grading exams, and one student had calculated P(\text{Heart and Queen})=P(\text{Heart})P(\text{Queen}). And seeing the two problems were almost identical, calculated P(\text{less than 4 and odd number})=P(\text{less than 4})P(\text{odd number}) — which, as we know, isn’t right for dependent events.

What we were discussing is how we could explain to the student that the two situations are different, even though on the surface the questions seem like they are of the same form. In other words, is there a conceptual — non mathematical — way to explain that the first question involves independent events while the second question involves dependent events? It certainly isn’t intuitive, at least not to me.


