Monday is the start of the 4th — and final — quarter at my school. I desperately want my Multivariable Calculus students to really love the end of the course. In the same spirit as the rest of the course (focusing on basic concepts and applying them to very difficult problems), I have decided to assign half as much homework and have students spend their time really investigating a hard problem, researching an interesting topic, or creating something based on what we’ve learned. Their choice.
I whipped up a draft of my expectations for their end of year project, which I’m embedding below (Go Scribd! I’ve been waiting for this feature to be WordPress.com compatible for eons!). I know this is not an ideal set of expectations. I need to clean up the redundant language, provide examples of good and bad prospectuses, as well as have on hand sample rubrics for students to use as guides when creating their own. (As an aside, if you know of any prospectuses/rubrics for me to show them, I’d very much appreciate you throwing the link down in the comments!) But my thought now is that I’ll see what happens this year, and then tweak it for future years:
I also spent a number of hours coming up with possible Multivariable Calculus projects, posted at my Multivariable Calculus resource site. I hope to add to it as ideas strike me. I’ll copy the projects that I have as of April 11, 2009, below the fold. But click the link above for a list that will hopefully be updated.
Below are ideas for your fourth quarter projects. Feel free to choose one and expand on it, or pick something on your own and (through consultation with me) run with it! The fundamental thing you need to think about when choosing a topic is: does this excite me? If it doesn’t, if you don’t get the sense of “oh my gosh, I can’t wait to start working on this,” you should think twice about choosing it.
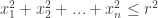
1. The Volume of the Sphere in Higher Dimensions. In 2D, a sphere can be described by 


2. Hurricane Modeling: In higher mathematics, you can take courses on “fluid dynamics” — how fluids move. In such a course, you’ll learn that gases can be model as fluids, and some of the beasts we’ve encountered in Multivariable Calculus will rear their heads again (e.g. vector valued functions, vector fields, etc.). Anton explores how one can model hurricanes using what we’ve learned thus far (p. 1183-1187). Read the text and do the 12 exercises presented. If time permits, do some basic research on “fluid dynamics.”
3. Lissajous Curves: Earlier in this course, we’ve encountered Lissajous curves. They were pretty, but we never really explored them. They can be (in 2D) described by the parametric equations 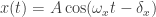

4. Harmonograph: If you are interested in Lissajous curves but are good at creating things, build a “harmonograph” — a machine that produces Lissajous Curves. Watch the video below to see what I’m talking about:
It appears to involve a few dowels, some clamps, some weights, and a lot of patience.
5. If you learned Newton’s Method (an elegant algorithm to find the zeros of a function in one dimensions), do some research on Newton’s Method in 2 dimensions. In other words, find at what points 

Resources:
http://www.math.gatech.edu/~carlen/2507/notes/NewtonMethod.html http://ktuce.ktu.edu.tr/~pehlivan/numerical_analysis/chap01/NewtonSystem.pdf
6. River Navigation Problem: I found this problem (and solution) online. If you chose to do this, you must promise not to look at the solution. You can come to me when you get stuck, and we can work through those tough patches together. However, I want you to work on this without peeking at the solution.
Kirk and Rose have misread their maps while on a hiking date. After walking around aimlessly for three hours they finally come upon a ranger station. It is on the opposite side of a river whose straight banks are 150 feet apart. The good news is that there is a small motor boat tied to a dock with a call box on their side of the river. They phone the ranger station and learn: (1) the river current flows parallel to its banks, and its speed at any point x feet from either bank is
feet per second; (2) the boat travels at a constant rate of 5 feet per second in still water. They also receive some bad news: (1) the boat has a broken rudder and can only head in a fixed direction; (2) the land is infested with poisonous snakes on the ranger station side of the river, so they must head off at an angle that results in their arriving exactly at the dock in front of the ranger station. So at what angle should they set off to arrive at the ranger station.
(7) Explore the challenge problems listed at Oliver Knill’s Multivariable Calculus website. Each of the problems are given a ranking (*** or ****) based on difficulty. Do enough problems so that you have amassed 20 *s.
(8) As you’ve noticed, much of what we’ve done in Multivariable Calculus is based in vectors. But where did this come from? Who did this come from? Read Michael J. Crowe’s book A History of Vector Analysis: The Evolution of the Idea of the Vectoral System (preview of book here at Google) and write a comprehensive book review.
(9) Contour Maps and Gradients: There are lots of map materials available on the web (EPA, US Geological Survey). The use of global positioning systems (GPS) is leading to tremendously accurate maps. Examine level sets of various properties (rainfall, temperature, etc). Calculate directional derivatives, gradients, draw flow lines, calculate average value of functions all based on these maps. This project was directly lifted from here.
(10) Maps: Maps of the world and the different pro jections used to draw them. The problem of how to represent a three dimensional sphere on a two dimensional paper is tricky and has been approached in many different ways. One standard method is the Mercantor pro jection. This topic relates to different coordinate systems: note that spherical coordinates are closely related to longitude and latitude. Like the previous project, this project was directly lifted from here.
(11) Tools for the Mathematics Teacher. Much of what we’ve covered this year is visual. WinPlot has been extraordinarily useful for us. However, there are times when WinPlot just doesn’t cut it. For example, when explaining double integrals, Fred’s cookie cutter analogy couldn’t be beat! Dream up some tools that would make explaining some concepts from Multivariable Calculus easier. For example, you can create a set of wire sculptures that illustrate curvature/radius of curvature. If you know how to work with clay, you can create some famous surfaces. You can come up with a foam model that shows students the idea of double integrals, or triple integrals. Or use string to show the intersection of various surfaces, a la Theodore Olivier (see some info and pictures of his models here). I have some photographs of some of Olivier’s models from when I visited the Musee des Arts et Metiers in Paris, so if you want to see them, I can pass them along for your edification and inspiration.
(12) William Thomson (a.k.a. Lord Kelvin) studied — among many other things — bubbles. He said “Blow a soap bubble and observe it. You may study it all your life and draw one lesson after another in physics from it.” Investigate the mathematics behind soap bubbles and their relationship to “minimal surfaces” — surfaces whose mean curvature is zero (see Wikipedia page here). Create these surfaces by making wire frames from hangers and dipping them into a soap solution. Do experiments and take photographs of your bubbles, write a paper, go in whatever direction you want!
Resources:
http://epinet.anu.edu.au/mathematics/minimal_surfaces
http://books.google.com/books?id=Ep7nQUz7RPMC&printsec=frontcover
http://www.instructables.com/id/Minimal-Surfaces-With-Metal-Shapes-and-Soap-Bubble/ http://www.math.northwestern.edu/~wphooper/fun/bubbles/
(13) Centroid and Center of Gravity. Get some foam board and draw an accurate coordinate system on it. Accurately draw a few regions on the board and calculate the centroid of this figure. Label the centroid on the figure. To show it truly is a centroid, carefully and safely use an exacto knife to accurately cut out the figure. Thread a needle and push it through the calculated centroid and and dangle the figure in the air. Does it rest flat or lean?
When you’ve finished that, use a second piece of foam board with an accurate (rectangular) grid on it. Measure the weight of the board, and use that to calculate the weight of each square drawn on it. Then stick some heavy pushpins in the center of a random selection of squares. Measure the weight of a single pushpin. Using this information, calculate the center of gravity of this object. Thread a needle and push it through the calculated center of gravity. Does it rest flat or lean?
Lastly, cut out a few random squares from that second piece of foam board, and repeat.
(14) Research Maxwell’s Equations and explain them. Resource: Daniel Fleisch’s A Student’s Guide to Maxwell’s Equations.
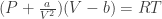
(15) Investigate the Ideal Gas Law (


Resources:
http://en.wikipedia.org/wiki/Van_der_Waals_equation_of_state
http://en.wikipedia.org/wiki/Van_der_Waals_constants_(data_page)
(16) If you know a thing or two about programming or are willing to learn some basic Mathematica, explore the Wolfram Demonstration Projects for Multivariable Calculus here. Find a topic in Multivariable Calculus that hasn’t been illustrated yet, or one that might be poorly illustrated, and create your own Demonstration! (If you are dedicated to doing this, please inform me ASAP because I have to (somehow) get you a copy of Mathematica. To convince yourself that it isn’t impossible and that the coding isn’t terribly long, please look at some of the source codes for the demonstrations you like (you can see the source code for every Demonstration by clicking on the button saying “Show Source Code” at the bottom of each Demonstration page).
(17) In class this year, we encountered how to find a normal vector (N) and a tangent vector (T) to a curve defined parametrically. We also briefly talked about and calculated a binormal vector (B) — a vector orthogonal to both the normal and tangent vector. It turns out that these three unit vectors (N, T, B) taken together form something called a “Frenet Frame.” These three variables are also related via curvature and torsion through a set of three equations known as the Frenet-Serret formulas (see Wikipedia pagehere). Investigate what torsion is (we have already talked about curvature), and write a paper for someone just slightly less capable in math than you are explaining the N, T and B are, what the Frenet-Serret formulas are, and if you have time, how this all relates to physics. Resource: http://demonstrations.wolfram.com/FrenetFrame/
(18) We have been learning to use WinPlot as we’ve been going along. Do some research (there are about a zillion webpages online for tutorials/instructions) on how to use WinPlot and create a student tutorial handbook (either a paper handbook, or even better, an online handbook) for next year’s Multivariable Calculus class for how to use WinPlot. It should cover how to use WinPlot basically (how to put gridlines on a graph, how to vary the window size, etc.) and how to do Multivariable Calculus specific things (e.g. plot in 3D, calculate the intersection of two surfaces, create level curves, etc.). WinPlot is powerful and this project will show you how powerful it truly is. (Plus the skills you learn here might help you in college.) If you are scared of making an online handbook, I can show you how. It is supremely easy! Resource: http://math.exeter.edu/rparris/wpsupp.html
(19) Origami has actually started making headway into the lives of professional mathematicians — not only as a lark, but as a source of some deep mathematics (see the work of Eric Demaine, for example). In Thomas Hull’s book Project Origami, it appears that there is a project called “Five Intersecting Tetrahedra.”

You can construct this figure and work on the mathematics behind this figure (Activity #11) in the book — where you will find the “optimal strut width” of this figure using multivariable calculus.
Resources:
http://www.akpeters.com/product.asp?ProdCode=2582
http://books.google.com/books?id=HlT6Vt3CnDUC&printsec=frontcover#PPA110,M2
(20) Other ideas can be found here. Also, you can consider designing your own 3 day unit (with lesson plans, homework, smartboards, worksheets, etc.) for a particular topic that we learned that captured your interest.

Your students are fortunate. This is a pretty impressive list of projects. I’ll look forward to reading about how they take to it. Good luck!
@David: Thanks. I only have 4 students, so I went a little bit overboard in creating this list. But I’m so fascinated with this course that these are things I secretly really want to do!
If you stick lissajous figures in the TI, and you make the coefficients kind of big, and relatively prime (eg, 123 and 149) you get pretty patterns that are part figure, part pixel interference.
But I like the other projects.
My only class of 4 in my life was AP Physics senior year where. The guy loved math and we did a bunch of that stuff there.
But better than that, we did lots of things with the same ‘flavor’ as these projects. It was a great class, and this really reminds me of it…
Jonathan
@Jonathan: we are using winplot and MVT (mathematical visualization toolkit) to plot in this course, actually… so hopefully we won’t have any of that pixel problems…
Yeah, this class is fun!
Sam
Those are the best kind of projects to assign. You have put a lot of thought into the projects and I am sure your students will respond accordingly. 4 students in the class…huh? Class size reduction at its finest. :)
My major concern, more than anything else, is senioritis. We’ll see if they can avoid that long enough to be proud of what they produce.