The guilt that I feel for not blogging more regularly this year has been considerable, and yet, it has not driven me to post more. I’ve been overwhelmed and busy, and my philosophy about blogging it is: do it when you feel motivated. And so, I haven’t.
Today, I feel a slight glimmer of motivation. And so here I am.
Here’s what I want to talk about.
In calculus, we all have our own ways of introducing the power rule for derivatives. Graphically. Algebraically. Whatever. But then, armed with this knowledge…
that if 

…we tend to drive forward quickly. We immediately jump to problems like:
take the derivative of

and we hurdle on, racing to the product and quotient rules… We get so algebraic, and we go very quickly, that we lose sight of something beautiful and elegant. This year I decided to take an extra few days after the power rule but before problems like the one listed above to illustrate the graphical side of things.
Here’s what I did. We first got to the point where we comfortably proved the power rule for derivatives (for n being a counting number). Actually, before I move on and talk about the crux of this post, I should show you what we did…
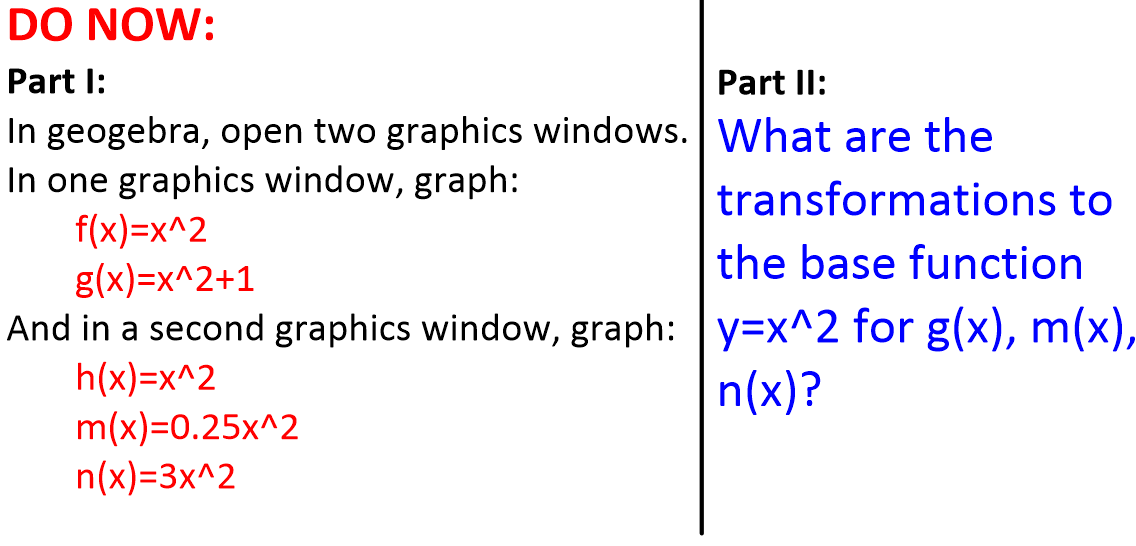
Okay. Now I started the next class with kids getting Geogebra out and plotting on two graphics windows the following:
 and they saw the following:
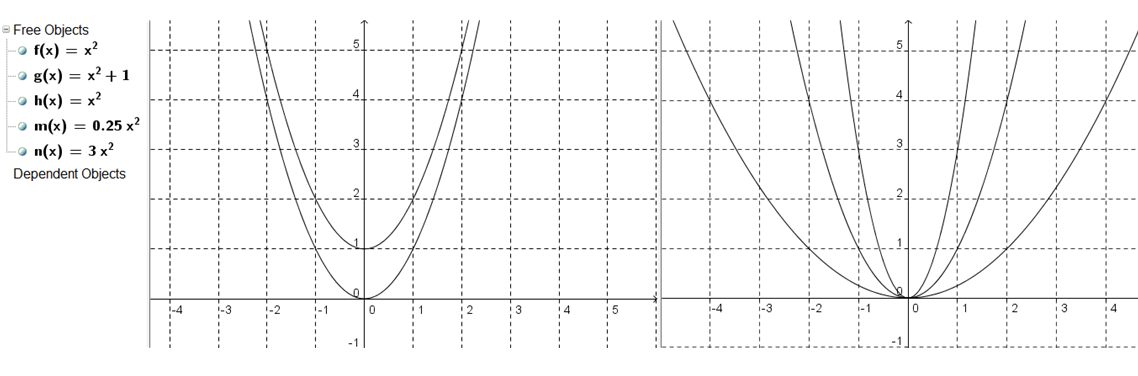 At this point, we saw the transformations. On the left hand graph, we saw that the function merely shifted up one unit. On the right hand graphs, we saw a vertical stretch for one function, and a vertical shrink for the other.
Here’s what I’m about to try to illustrate for the kids.
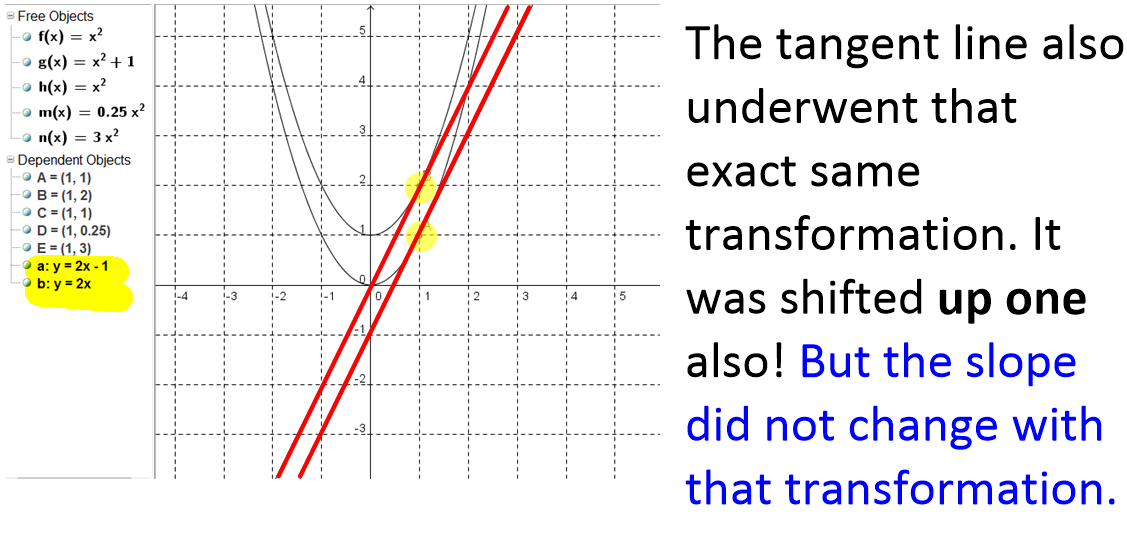
Whatever transformation a function undergoes, the tangent lines to the function also undergoes the exact same transformation.
What this means is that if a function is shifted up one unit, then all tangent lines are shifted up one unit (like in the left hand graph). And if a function undergoes vertical stretching or shrinking, all tangent lines undergo the same vertical stretching or shrinking.
I want them to see this idea come alive both graphically and algebraically.
So I have them plot all the points on the functions where 
For the graph with the vertical shift, they see:
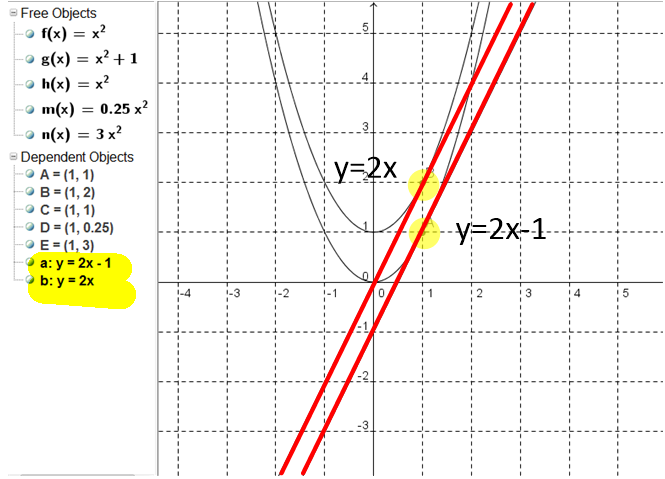
The original tangent line (to 

Our conclusion?
 Yup. The tangent line changed. But the slope did not. (Thus, the derivative is not affected by simply shifting a function up or down. Because even though the tangent lines are different, the slopes are the same.)
Then we went to the second graphics view — the vertical stretching and shrinking. We drew the points at
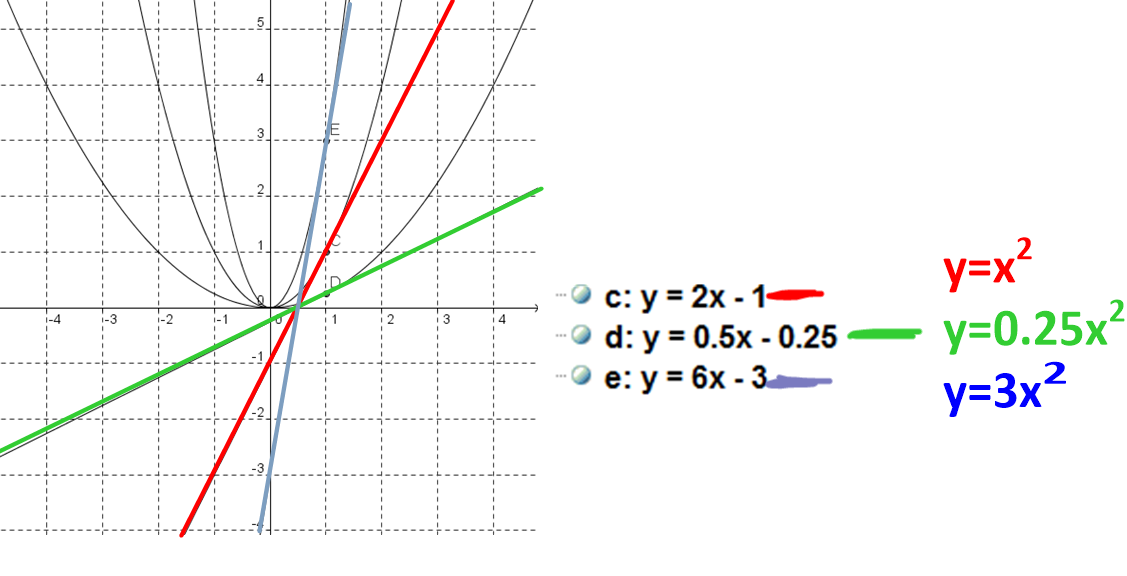
…and we see that the tangent lines are similar, but not the same. How are they similar? Well the original function’s tangent line is the red one, and has the equation
To show that clearly, we did the following. The original tangent line has equation 

Similarly, for the blue function with a vertical stretch of 3, we get 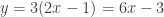
What do we conclude?

And in this case, with the vertical stretching and shrinking of the functions, we get a vertical stretching and shrinking of the tangent lines. And unlike moving the function up or down, this transformation does affect the slope!
I repeat the big conclusion:
Whatever transformation a function undergoes, the tangent lines to the function also undergoes the exact same transformation.
I didn’t actually tell this to my kids. I had them sort of see and articulate this.
Now they see that if a function gets shifted up or down, they can see that the derivative stays the same. And if there is a vertical stretch/shrink, the derivative is also vertically stretched/shrunk.
The next day, I started with the following “do now.” We haven’t learned the derivative of 
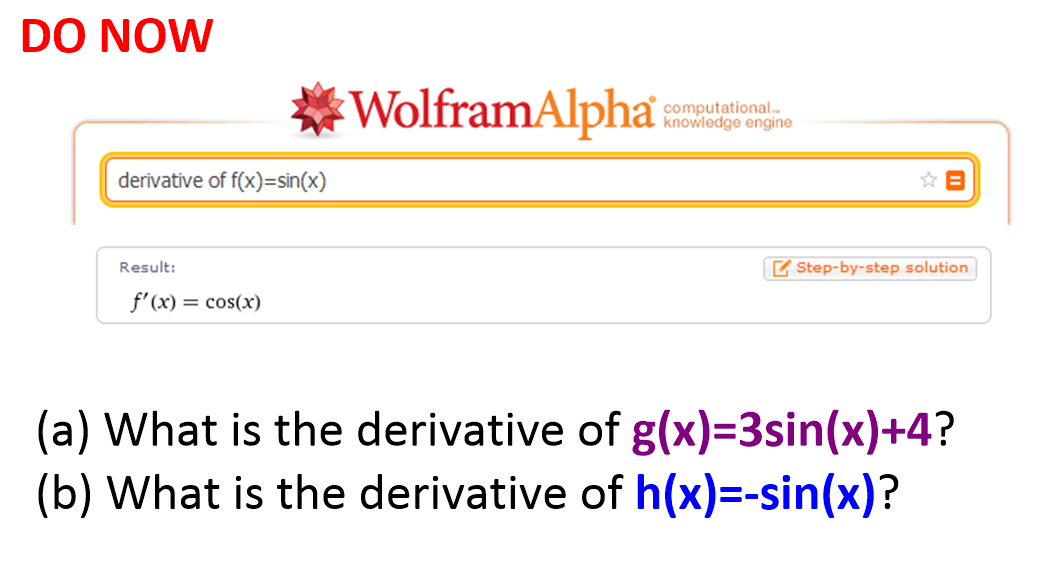
For (a), I expect them to give the answer 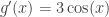

The good thing here is now I get to go for depth. WHY?
And I hear conversations like: “Well, g(x) is a transformation of the sine function which gives a vertical stretch of 3, and then shifts the function up 4. Well since the function undergoes those transformations, so does the tangent lines. So each tangent line is going to be vertically stretched by 3 and moved up 4 units. Since the derivative is only the slope of the tangent line, we have to see what transformations affect the slope. Only the vertical stretch affects the slope. So if the original slope of the sine function was 

That’s beautiful depth. Beautiful.
For (b), I heard talk about how the negative sign is a reflection over the x-axis, so the tangent lines are reflected over the x-axis also. Thus, the slopes are the opposite sign… If the original sine functions slope of the tangent lines was 
This isn’t easy for my kids, so when I saw them struggling with the conceptual part of things, I whipped up this sheet (.docx).
And here are the solutions
And here is a Geogebra sheet which shows the transformations, and the new tangent line (and equation), for this worksheet.
Now to be fair, I don’t think I did a killer job with this. It was my first time doing it. I think some kids didn’t come out the stronger for this. But I do feel that the kids who do get it have a much more intuitive understanding of what’s going on.
I am much happier to know that if I ask kids what the derivative of 

our base function is 


To me, that sort of explanation for something super simple brings so much graphical depth to things. And that makes me feel happy.

I love this. The notion of taking some time to really see the power of something before plowing forward with what is, as you say, really just algebra is a great idea, and one I want to try to do better on.
Will you do the same thing for the chain rule with things like f(x)=sin(2x)?
Thanks! I thought about it, but I decided against it (when I get there). The reason is because (a) I don’t feel like I have the time, (b) kids don’t come in with a deep understanding of why horizontal stretching/shrinking happens and I don’t want to teach that, and (c) as soon as that inner function becomes something like x^2, everything goes to hell. It then gets way too abstract.
So I think I’m going to call this a victory, and stop. Unless you have something in mind???
Of course you should declare victory! I guess doing the simple example (sin(2x)) might be cool just to connect to this stuff, but I totally get your point about how it gets abstract pretty fast.
If you want to pursue it farther and not get too abstract, you can prove the chain rule visually if you do function diagrams a la Henri Picciotto. The chain rule bit is at http://www.mathedpage.org/func-diag/#composition but you probably want to start at the top of the page and spend a bunch of time before getting there.
Probably too much novelty to introduce in your classroom, but still worth doing and enjoying for yourself.
By the way, nice to have you back, and great post! I love the idea of transformations as the big unifying topic of high school math, and they way they touch algebra, geometry, trig, and calculus is really clear in this example you’ve given.
Wow, this is really cool! I have never seen these function diagrams before… They are wild, and ripe for exploration!
Oh yeah, and http://betterexplained.com/articles/derivatives-product-power-chain/ and the other calculus articles on his site are also fantastic intuition-builders.
Brilliant, Sam! You continue to motivate me. I know what I will be doing for the two days before Thanksgiving…
This is a really lovely investigation in miniature. I love the way you use these kinds of discovery sheets to help students slow down and really notice the effect of transformations. Depth *and* grace — another Tour de Force!
– Elizabeth (@cheesemonkeysf)
Thanks Elizabeth. You’re too sweet! Depth *and* grace? I’ll take it!
Superb Post, Sam! You continue to motivate to all. I know what I will be doing for the two days before. I like your unique way of studying. You have done good job. I think you have huge collection of it. These are new for me.
Thank you so much for writing this. I plan to do this activity with my students now as well.