Each year, I have students in my multivariable calculus class do “fourth quarter projects.” We continue working with the material during classtime, they have regular nightly work, but I cancel all problem sets and tests. Instead, students choose a project topic they are interested in pursuing that has some relationship to the course (even if the relationship is a bit tenuous). I want the project to be one of passion. Their entire fourth quarter grade is based on these projects. This year, my kids came up with some amazing projects — some of the best I’ve seen in my eight years of teaching this course. (Some previous years projects are here, here, here, and here.)
An Augmented Reality Sandbox
Earlier in the year, I showed my student a video of an augmented reality sandbox that I stumbled across online. She showed interested in making it. It takes in a mapping of a surface (in this case sand in a sandbox) and projects onto the surface colors representing the height of the sand over time (so red is “high” and blue is “low”). The cool part about this is that the projection changes live — so if you change the sand height, the projection updates with new colors. Level curves are also “drawn” on the sand.
Here are some videos of it in action (apologies for the music… I had to put music on it so the conversations happening during the playing with the sand were drowned out):
The student was going to design lesson plans around this to highlight concepts in multivariable calculus (directional derivative, gradients, gradient field, reading contour maps) but ran out of time. However upon my suggestion, during her presentation, she did give students contour maps of surfaces, turned off the projector, had students try to form the sand so it matched the contour map, and then turned the projector on to have students see if they were right or not.
During the presentation, one student who I taught last year (but not this year) said: “This is the coolest thing I’ve seen all year!” and then when playing with the sand: “I AM A GOD!” Entrancing!
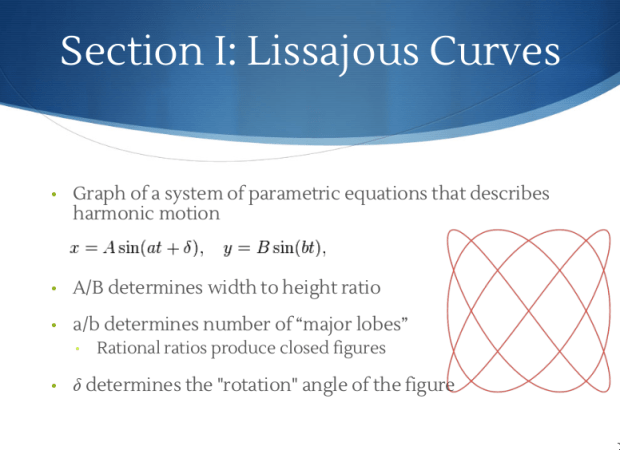
Harmonograph
In my first year of teaching this course, a student was entranced by lissajous curves when we encountered them. These are simple parametric equations which create beautiful graphs. I then suggested for his final project that he create a harmonograph, which he did. Seven years later, I had another student see the original video of my student’s harmonograph, and he wanted to build his own! But he wanted his to have a rotary component, in addition to two pendulums which swung laterally. So he found instructions online and built it!
Here are some of the images it produced:


And here is a video of the harmonograph in motion:
(You can watch another video here.)
During the presentation, the student talked about the damping effect, how the pendulum amplitudes and periods had an effect on the outcome, and how lissajous curves were simply shadows of lissajous knots that exist in 3-space. Because of the presentation, I had some insights into these curves that I hadn’t had before! (I still don’t know how mathematically to account for how the rotary pendulum in the student’s harmonograph affects the equations… I do know that it has the harmonograph — in essence — graph the lissajous curves on a somewhat rotating sphere (instead of a flat plane). And that’s interesting!
Teaching Devices for Multivariable Calculus
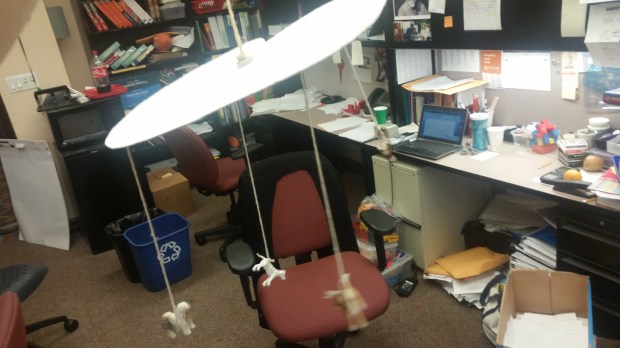
A student was interested in creating tools for teachers to illustrate “big” multivariable calculus ideas… Contour lines, directional derivatives, double integrals, etc. So she made a set of five of super awesome teaching manipulatives. Here are three of them.
The first is a strange shaped cutout of poster-cardboard-ish material, with four animals hanging from it. Then there is string connected to a magnet on top, and another magnet on the bottom. If you hold up the string and you aren’t at the center of mass, the mobile won’t balance. But if you move the magnet around (and the student used felt around the magnet so it moves seamlessly!), you can change the position of the string, until it balances. This is a manipulative to talk about center of mass/torque.
Another is a set of figures that form “level curves.” At first I was skeptical. The student said the manipulative elow was to help students understand countour plots. I wanted to know how… Then the moment of genius…
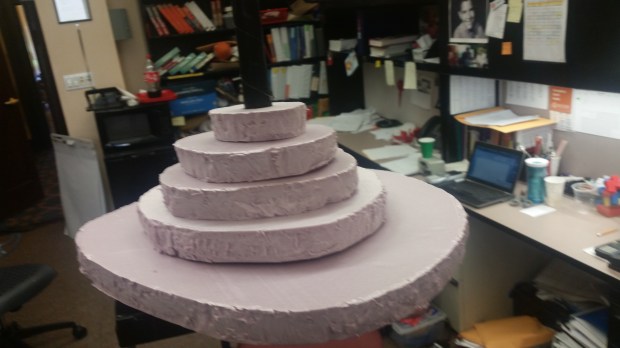
You can change the height of the level curves to make the “hill” steeper and steeper, and then look straight down at the manipulative. If you have a shallow “hill,” you have contour lines which will look far apart. If you have a tall “hill,” you have contour lines which look close together.


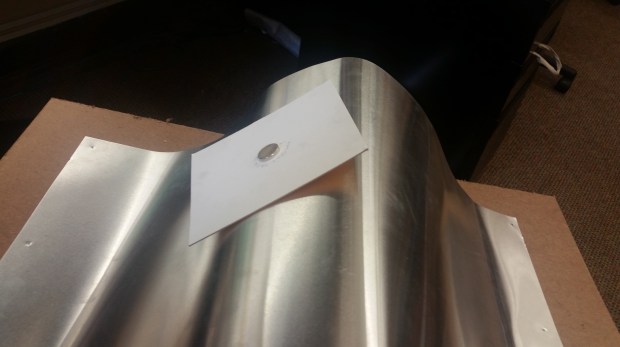
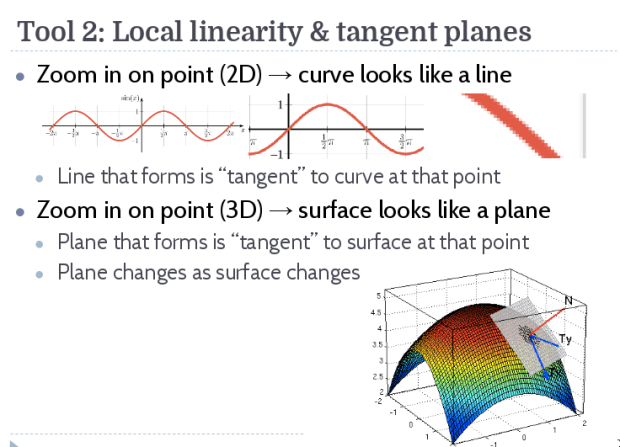
Finally, a third manipulative showcases the tangent plane (and it can move around the surface because of magnets also). I can see this also being useful for normal vectors and even surface integrals!
Cartographic Mapping
Two students decided to work together on a project dealing with cartographic mapping. They were intrigued by the idea that the surface of the earth can’t perfectly be represented on a flat plane. (They had to learn about why — a theorem by Euler in 1777.) They chose two projections: the Gall Peters projection and the Stereographic projection.


They did a fantastic job of showing and explaining the equations for these projections — and in their paper, they went into even more depth (talking about the Jacobian!). It was marvelous. But they had two more surprises. They used the 3D printer (something I know nothing about, but I told them that they might want to consider using to to create a model to illustrate their projections to their audience) and in two different live demos, showed how these projections work. I didn’t get good pictures, but I did take a video after the fact showing the stereographic projection in action. Notice at the end, all the squares have equal area, but the quadrilaterals on the surface most definitely do not have equal area.
An added bonus, which actually turned out to be a huge part of their project, was writing an extensive paper on the history of cartography, and a critical analysis of the uses of cartography. They concluded by stating:
We have attempted, in this paper, to provide our readers with a brief historical overview of cartography and its biases. This paper is also an attempt to impress upon the reader the subjective nature of a deeply mathematical endeavor. While most maps are based around mathematical projections, this does not exclude them from carrying biases. In fact, we believe there is no separation between mathematical applications and subjectivity; one cannot divorce math from perspective nor maps from their biases. We believe it is important to incorporate reflections such as this one into any mathematical study. It is dangerous to believe in the objectivity of scientific and numerical thought and in the separation between the user and her objective tools, because it vests us, mathematicians and scientists, with arbitrary power to claim Truth where there is only perspective.
Beautiful. And well-evidenced.
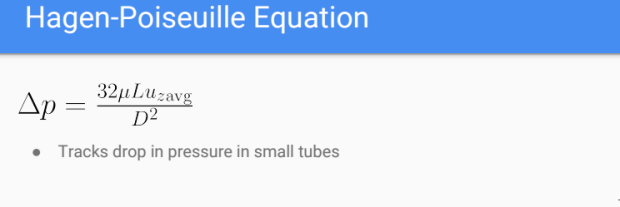
Deriving the Hagen-Poiseuille Equation from the Navier-Stokes Equations
One student was interested in fluid dynamics. So I introduced him to the Navier Stokes equations, and set him loose. This turned out to be a challenging project for the student because most of the texts out there require a high level of understanding. Even when I looked at my fluid dynamics book from college when I was giving it to him as a reference, I realized following most of it would be almost impossible. As he worked through the terms and equations, he found a perfect entree. He learned about an equation that predicts the change in pressure from one end of a tube of small radius to another (if the fluid flow in the tube is laminar). And so using all he had learned in his investigation of the field, he could actually understand and explain algebraically and conceptually how the derivation worked. Some of his slides…
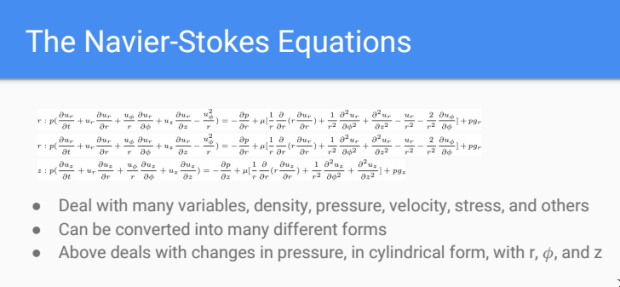
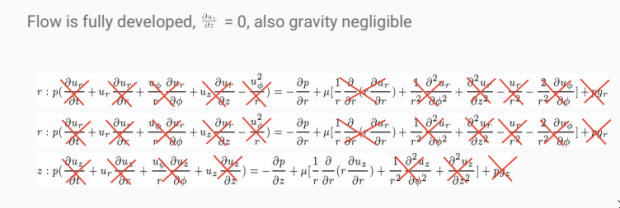
It was beautiful because he got to learn about partial differential equations, and ton of ideas in fluid dynamics (viscosity, pressure, rotational velocity, sheer, laminar flow, turbulence, etc.), but even needed to calculate a double integral in cylindrical coordinates in his derivation!
The Wave Equation and Schrodinger’s Equation
This student works in a lab for his science research class — and the lab does something with lasers and quantum tunneling. But the student didn’t know the math behind quantum mechanics. So he spent a lot of time working to understand the wave equation, and then some time trying to understand the parts of Schrodinger’s equation.
In his paper, he derived the wave equation. And then he applied his understanding of the wave equation to a particular problem:
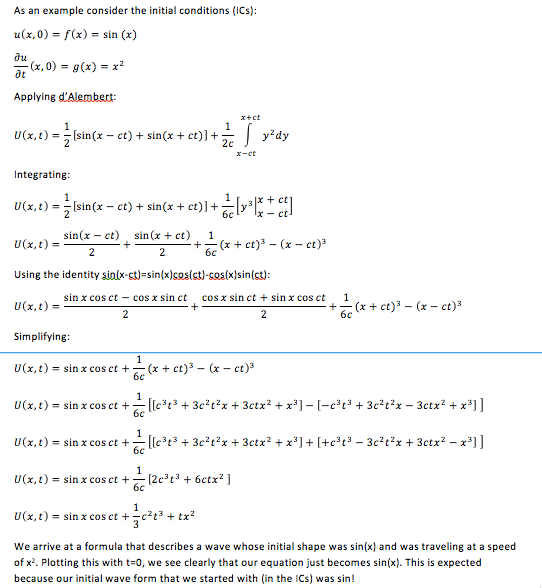
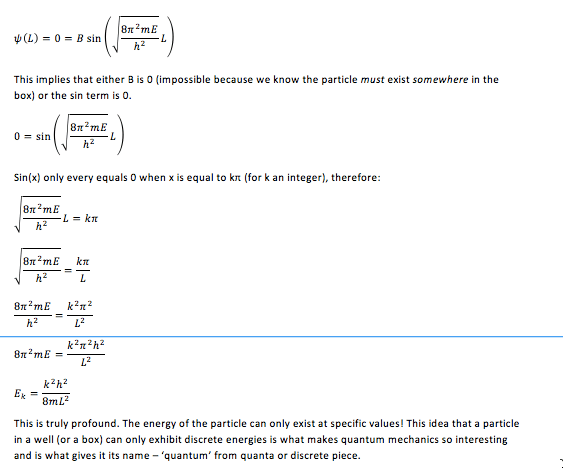
He then tackled Schrodinger’s Wave Equation and saw how energy is quantized! Most importantly, how the math suggests that! I remember wondering how in the world we could ever go from continuousness to discreteness, and this was the type of problem where I was like “WHOA!” I’m glad he could see that too! Part of this derivation is below.
Overall, I was blown away by the creativity and deep thinking that went into these final projects. Most significantly, I need to emphasize that I can’t take credit for them. I was incredibly hands off. My standard practice involves: having students submit three ideas, I sit down with students and help them — with my understanding of their topics and what’s doable versus not doable — narrow it down to a single topic. Students submit a prospectus and timeline. Then I let them go running. I don’t even do regular formal check-ins (there are too many of them for me to do that). So I have them see me if they need help, are stuck, need guidance or motivation, whatever. I met with most of them once or twice, but that’s about it. This is all them. I wish I could claim credit, but I can’t. I just got out of their way and let them figure things out.

gorgeous post! Especially Harmonograph.
Hey Sam,
we just noticed your project and watched the video! We appreciate that you try something different to approach math :) We also believe that it will have a great impact on your students’ motivation. It is fantastic that you want to get your students more involved and have them chose there own topic concerning there passion. In our schools students have to face an overload of math tests and therefore often lose their enthusiasm towards math. So this is a very welcoming change! By the way we read your additional information on the video, but we still can’t figure out how the light works? Is it a special program that you use?
If you google “augmented reality sandbox” you’ll find how-to tutorials on how to build one. There is a program that you download and use to have the projection automatically update!
Hey there! I just wanted to share my experiences with you concerning projects at school. I held a class last year and I was very disappointed that it didn’t really work out the way I expected. That’s why I am a little bit concerned in taking up further projects. Don’t get me wrong I believe projects to be a great advantage of teaching! It is just my own experiences that weren’t too successful. What about you sam? How is everything working out? Do you think I should give it another try? It is probably worth it when I see your and our students’ effort.
I wish you all the best!
Howdy! I can’t really say whether it is worth it without a lot lot lot more context about your school, your kids, and most importantly, how you created the project idea and structured it for kids. I am not a huge fan of projects, normally, but this class is the exception. I think if you have someone at your school who does projects that you respect (think there is a lot of learning going on when doing them), they would be the person to talk to!
Thanks a lot! We will definitly look it up :)
Good look with your project! We are looking forward to your progress.