A few days I got an email from someone (Jeremy Jones) who wanted me to look at their video on standard deviation. And then today, I was working with Mattie Baker at a coffeeshop. He was thinking about exactly the same thing — how to get standard deviation to make some sort of conceptual sense to his kids. He said they get that it’s a measure of spread, but he was wondering how to get them to see how it differs from the range of a data set (which also is a measure of spread).
Of course I was hitting a wall with my own work, so I started thinking about this. While watching Jeremy Jones’s video, I started thinking of what was happening graphically/visually with standard deviation.And I had an insight I never really had before.
So I made an applet to show others this insight! I link to the applet below, but first, the idea…
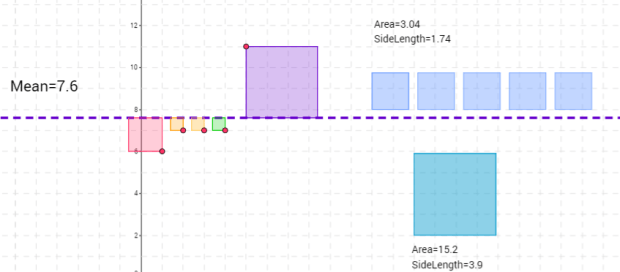
Let’s say we had the numbers 6, 7, 7, 7, 11. What is the standard deviation?
First I calculate the mean and plot/graph all five numbers. Then I create “squares” from the numbers to the mean:

The area of those squares is a visual representation of how far each point is from the mean.[1] So the total areas of all those five rainbow squares is a measure of how far the entire data set is from the mean.
Let’s add the area of all those squares together to create a massive square.

As I said, this total area is a measure of how far the entire data set is from the mean. How spread out the data is from the mean.
Now we are going to equalize this. We’re going to create five equal smaller squares which have an area that matches the big square.
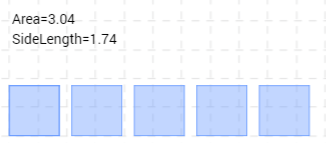
We’re, in essence, “equalizing” the five rainbow colored squares so they are all equal. The side length of one of these small, blue, equal squares is the standard deviation of the data set. So instead of having five small rainbow colored squares with different measures from the mean, the five equal blue squares are like the average square distance from the mean. Instead of having five different numbers to represent how spread out the data is from the mean, this equalizing process lets us have a single average number. That’s the standard deviation.
I’m not totally clear on everything, but this visualization and typing this out has really help me grok standard deviation better than I had before.
I created a geogebra applet. You can either drag the red points up and down (for the five points in the data set), or manually enter the five numbers.
https://www.geogebra.org/m/EatncEg2
My recommendation is something like this:
- {4, 4, 4, 4, 4}. Make a prediction for what the standard deviation will be. Then set the five numbers and look at what you see. What is the standard deviation? Were you right?
- {8, 8, 8, 8, 8}. Make a prediction for what the standard deviation will be. Then set the five numbers and look at what you see. What is the standard deviation? Were you right?
- Set the five numbers to {2, 4, 4, 4, 6} and look at what you see. What is the standard deviation?
- Consider the number {5, 7, 7, 7, 9}. Make a prediction if the standard deviation will be higher or lower or the same as the standard deviation in #3. Then set the five numbers to {5, 7, 7, 7, 9} and look what you see. What is the standard deviation? Were you right?
- Consider the numbers {3, 7, 7, 7, 11}. Make a prediction if the standard deviation will be higher or lower or the same as the standard deviation in #4. Explain your thinking. Then set the five numbers to {3, 7, 7, 7, 11} and look at what you see. What is the standard deviation? Were you right?
- Consider the numbers {3, 6, 7, 8, 11}. Make a prediction if the standard deviation will be higher or lower or the same as the standard deviation in #5. Explain your thinking. Then set the five numbers to {3, 6, 7, 8, 11} and look at what you see. What is the standard deviation? Were you right?
- What do you think the standard deviation of {4, 8, 8, 8, 12} be? Why? Check your answer with the applet.
- Can you come up with a different data set which matches the standard deviation in #6? Explain how you know it will work.
- Set the five numbers to {4, 4, 4, 4, 4}. Initially there are no squares visible. The standard deviation is 0. Now drag one of the numbers (red dots in the applet) up. Describe what the squares look like when they appear? Eventually drag that number to 15. What do you notice about the standard deviation? Use your understanding of what happened to describe how a single outlier in a data set can affect the standard deviation
Okay, I literally just whipped the applet up in 35 minutes, and only spent the last 15 minutes coming up with these scaffolded questions. I’m sure it could be better. But I enjoyed thinking through this! It has helped me get a geometric/visual sense of standard deviation.
Now time to eat dinner!!!
Update: a few people have pointed out that the n in the denominator of the standard deviation formula should be n-1. However that would be for the standard deviation formula if you’re taking a sample of a population. This post is if you have an entire population and you’re figuring out the standard deviation for it.
[1] One might ask why square the distance to the mean, instead of taking the straight up distance to the mean (so the absolute value of each number minus the mean). The answer gets a bit involved I think, but the short answer to my understanding is: the square function is “nice” and easy to work with, while an absolute value function is “not nice” because of the cusp.

Wow, I’m teaching this right now and I think it will help….I’ll try it out. Thanks!
Yay! What luck!
Place a number of equal sized weights (masses) on a horizontal light rod –
w – – – – – w – – – w – – – – – w
with positions -8, -2, 2, 8
and spin them round the vertical axis.
Change the positions to -6, -4, 4, 6
and spin them again. Less effort is required.
And the standard deviation of the positions is smaller, though the mean absolute deviation is unchanged.
This is a feature of dynamic systems, called the radius of gyration.
Another thing with standard deviation is the RMS or root mean square voltage in an oscillating circuit. Root mean square is the definition of standard deviation.
RMS is the same as population standard deviation, but not of sample standard deviation. Of course, getting that distinction across to students who don’t quite get the idea of standard deviation is difficult.
Great visualization!
Just a little picky thing from an AP stats teacher: The standard deviation of a sample of data is the sum of the squares divided by n-1 whereas the standard deviation of the population is the sum of the squares divided by N. Dividing by n-1 allows for a little extra variation in the sample standard deviation because the sample is unlikely to have represented the full amount of variation in the population.
Thanks for sharing Sam. I will be featuring this in an upcoming GMD!
COOL! I literally made it for no particular purpose except I was curious about it because of talking with Mattie Baker. So I’d love it if *someone* found it useful. :)