Dan Meyer, in one of his recent WCYDWT, posted a picture of a roll of tickets (among other annuli).

So obvious is the question: how many tickets?
Of course more questions come tumbling out immediately, questions we need to ask to figure it out. What’s the inner and outer radius? What’s the length of one ticket? What’s the “thickness” of a ticket?
Dan sent me the information:
Inner Diameter: 27.77 mm
Outer Diameter: 168.65 mm
Length of a Ticket: 51.21 mm
Thickness of a Ticket*: 0.22 mm
The easy way to solve this is to find the area of the Annulus (the green area) and divide it by the area of the side of one ticket.
Of course the area of the red ticket is the “thickness” of the ticket multiplied by the length of the ticket.
 I put the ticket on the side, lying flat on a table. So the height of that rectangle is the thickness of the ticket (exaggerated for dramatic effect) and the width of that rectangle is the length of the ticket. And you can see how that rectangle becomes curved when it is part of the roll.
Clearly if we want to find how many tickets can be curved to form the entire green roll, we’ll simply have to find the area of the green roll (the annulus) and divide it by the area of a single ticket.
Using Dan Meyer’s numbers, we get the number of tickets to be:

This comes out to be about 1929.07 tickets.
(The true answer is 2000 tickets).
But sometimes you want to kill a fly with something more powerful than a fly swatter. Something that will be slightly more challenging. Chopsticks? Been done. A cannon? Hard to find them lying around. Calculus? OF COURSE!
(Also, Dan asked if there was a way to solve this with Calculus.)
I had a couple ideas, but the most interesting for me was to try to come up with a function to model the tickets being rolled around a tube.** If I could find an equation which twists around like a roll of tickets, I could then use calculus’ arc length formula. If you don’t know what that is, it is pretty darn powerful. Given any normal function — curvy, straight, you name it — you can find how long the function is!

The idea behind it is the idea behind most calculus ideas. Break up the function into a bunch of pieces, and approximate the pieces with lines segments. Then add the lengths of those line segments together. You have an approximation for the true length of the function. If you break the function into more and more pieces, your approximation gets better. And if you start breaking the function into an almost infinite number of pieces and adding those line segments together, you’re going to get an almost perfect length. That’s calculus, and I’m not going to go into how you add an infinite number of line segments together here, but don’t be daunted. It sounds much more difficult than it is in reality.
Regardless, the whole point here is if we can find a function to model the tickets being wound around and around and around, we can just apply the calculus arc length formula and find the length of all the tickets if they were rolled out!
 So the hard part about this problem is coming up with the equation to model the rolled up tickets. But it’s just a spiral. In particular, an Archimedean spiral.

In polar coordinates, the equation to get this spiral is the SUPER simple:  . You can’t get much simpler than that. It obviously takes
  radians to make one full circle (to start and end at the same angle). And in that radians, the spiral moves out from it’s previous location
  . That’s all we need. Seriously.
So first we’re going to model the ticket roll as if it does not have that hole in the center. It’ll first just be a spiral that will go on and on forever. We’ll then find where to start and stop this spiral to create the roll of tickets which starts at some inner radius and ends at some outer radius.
Look at that Archimedean spiral one more time. For our purposes, I want the distance between the red lines above to be the thickness of a single ticket. Does that make sense? That way the ticket’s are getting wound around and around and around, laying on top of one another.***
Remember that for each total revolution (), the spiral moves outwards from it’s previous location. We want that distance it moves outwards to be the thickness of the ticket. So we simply set the thickness (0.22 mm) equal to to find that  .
.
HOLLA! We now have the function we’re using to model the tickets:
 .
.
Dude, graph that on your TI-whatever and you’ll see a nice tight spiral.
Now to start and stop the spiral so it matches our roll of tickets. To do this, we need to graph it for only certain  values — so that we can get the spiral to start at the inner radius and stop at the outer radius. That’s just simple algebra, boys and girls! We’ll call the starting angle value
  and the ending angle value
  .
.
Since , we want to know what is that will bring the spiral out to the inner circle. That will be our starting angle! So  . Similarly we can set
  . The starting and ending angles are easily solved for, to get
  and
and  .
.
Graphing the spiral with these endpoints looks like:

We’ve done all the hard parts! Now we simply use the arc length formula in calculus (for polar equations) to find the length of the spiral! Again, I’m not going to explain the derivation, but the equation for arc length is:
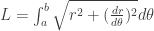
This gives us the length of a function, from one endpoint to another. Applying our equation for  into this, we get:
 .
.
Using the calculator to solve this, we get  mm. That’s the whole length of the roll of tickets, if it the tickets were laid out flat instead of rolled up. So by simply dividing this by the length of a ticket (51.21 mm), we get the number of tickets.
This comes out to be 1929.07 tickets. That’s what we got with calculus.
It seemed a bit crazy to me that the answer without calculus would be identical to the answer with calculus. It took a few minutes of thinking, but then it dawned on me that it would be crazy if they were not identical.
I wrote to Dan Meyer, explaining that I got the same answer using calculus that he did without, and that ex post facto, of course it made sense. I said:
Once I saw that we got the same answer, it dawned on me that they SHOULD be the same answer. (Isn’t that always the way in math?) Why wouldn’t they be the same? We’re both using the same initial data (inner radius, outer radius, thickness, and ticket length), and we’re not approximating anywhere in our calculations (we’re being exact).****
So there you go.
I just love that this simple algebra solution and this calculus solution turn out to be the same. Instead of showing me how useless calculus is (why do we need it if we can do it without?), I can’t help but cogitate on how amazing calculus is! These two methods are completely different! One is geometry. The other is based in functions. But both solutions are reducible to the same thing. They are really the same thing.
Now if you’re a calculete and you’re really interested in finding an exact — and non-calculator based solution — to the arc length integral, I suggest you look at the bottom of this page. It’s not hard, but also not the point of this post. I wanted to make the general process clear to someone who might not know calculus, but interested in the idea of how we can use it to solve the same problem. Of course, it’s a bit silly, way more firepower than you need. But it really gets you thinking about the ideas undergirding calculus, and there’s where I see the value in doing explorations like these.
PS. If you’re wondering why we’re not getting 2000 tickets, I think the answer is simple. In the initial data (the inner radius, the outer radius, the length of a ticket, and the thickness of a ticket), there was probably some error. I suspect it was with the thickness of the ticket — the hardest thing to actually measure. If the thickness of aticket was found to be 0.2124 mm (instead of 0.22 mm), then we would get precisely 2000 tickets! So if Dan were able to measure to the hundredths or thousandths accurately, I bet we would get something way closer to 2000 tickets.
—
*I seem to recall that Kate Nowak Jason Dyer suggested removing a bunch of tickets (50?) from the roll, stack them up, and measure the height. Use that to get the approximate thickness.
**Of course concentric circles would be possible, but then you’d get a summation, and blah blah blah. It all seems more precalculus than calculus.
***If that doesn’t make sense, try looking at this horrible picture of a shrimp. I mean ticket roll.
 **** If you say I rounded to 5 or 6 decimal places a few times, guilty. However, I actually calculated it without any rounding, and it comes out to be the same value. So there. Pfft. The rounding didn’t affect the answer to the hundredths place.
 . Plot
  equally spaced points on the circle starting from
  . Now draw the
  chords from
  , for those who already have seen or find the original problem too easy.)


 term that isn’t one, you have to divide the factors by that number. And then you do “bottoms up” where the
  gets converted to
  . I don’t like that you have to randomly divide by a number, nor that the implicit implication is that
  .
.

 as
as  (numbers from the diamond above)
 [1]
[1]
 so you factor that out and are left with
 and they understand how to factor
  . There is no lingering “why?”
 also and it would work.
  .
.