I have an awesome friend and colleague at my school who is a geogebra master. He has started keeping a blog — Geogebrart — posting fairly frequently some stunning, jaw-drapping mathematical art he created using this powerful program. Check this recent one out — which happens to be one of my favorites! Dualities!

Although I know most of the basics of Geogebra, I have not yet progressed to the stage passed “novice.” However I really want to get there, because this program is so freaking awesome.
When I was at TMC14 this summer, there was a sesh run by John Golden, Audrey McLaren, and Jedidiah Butler. They are like Jedi masters of Geogebra (though I know Audrey will play coy and say she isn’t…). When I was there, I learned about conditional objects, and it was awesome. (The google doc they used to help people out is here.) In about 30 minutes, with the help of John Golden and some kind people near me, I was able to make a rinky-dinky geogebra file which has a triangle on it, and has three points on the three different sides. When you drag each point close to where an altitude of the triangle would hit that side, I had something like “WOW!” or “YOU DID IT!” pop up! And if you got all three points close, something like “ALL THREE?! YOU’RE A SUPERSTAR!” show up.
Okay, okay, I wasn’t going to show you it because it’s sooooo dumb. But heck, whatever, here it is. Click on the image to check it out.

Okay, you and me, we both know that file is totally useless a teaching tool. And it is gross looking. By all accounts, I should not be excited by it. But the weird thing was: I was really proud of it, and I wanted to show everyone around me what I created. Even though I know it was simplistic and useless, I wanted to create a file that did X and I was able to do it! Although it felt dumb to get psyched about it, I was so excited that I could create something that would do what I wanted it to — that I couldn’t do before!
Today I was again inspired by my colleague and friend’s geogebra art, so I wanted to create some of my own.
I was quickly able to make this in 10 minutes [click on the picture to go to the file and mess around with the parameters! cool things happen!]
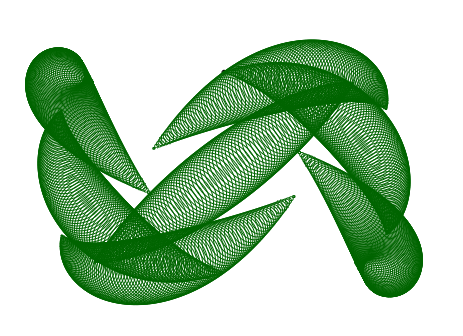 My goal was to define a curve parametrically and then have — at a ton of points on the curve — a circle to be drawn so it would look like a tube. That ended up looking only moderately neat. So I changed it so that as one traveled on the parametric curve drawing the circles, the radius of the circles would change (based on some formula I fed it). The reason this wasn’t so hard for me? I knew all the commands to do this except for the parametric curve command, which was easy to figure out.
But then I wanted to try my hand at something that would take more than 10 minutes and that would challenge me. I wanted to have something “show” a sphere via the animated drawing of “slices” (ellipses). It was inspired by this beautiful gif, but I knew that was going to be too hard for me to start out with. So I decided I would start out with a simple sphere with slices going horizontally and vertically, with no rotation.
After somewhere between 90 and 120 minutes, I did it! (You can click on the gif to go to the file and play around with some of the parameters.)
 Although the image isn’t as cool as the one that took me 10 minutes to create, I’m way prouder of this. It is because it took a ton of learning and trial and error in order to figure out how to do this. The set of problems I encountered and somehow figured out:
- I know how to create a single ellipse in the center of the circle, but how do I make another ellipse a certain distance away that still only touches the edge of the circle?
- How do I make the ellipses “width” (minor axis) decrease so that it is fattest near the equator, and almost like a line near the poles of the sphere?
- Without manually typing a zillion ellipses, how do I tell Geogebra to create all the vertical ellipses at once, and all the horizontal ellipses at once?
- The way I was generating the ellipses resulted in a problem… once an ellipse “hit the pole”(became a point), it would turn into a hyperbola. So I needed to find a way to make sure that once an ellipse “hit the pole” it would disappear.
I figured all this stuff out! So even though the sphere doesn’t look nearly as cool as I’d like, I feel so much more accomplished for it than with the super-cool-looking circles of variable radii drawn on a parametrically-defined curve.
***
Note: it’s amazing how “simple” this sphere image is once you figure it out. Once you create three sliders:
t goes from -5 to 5 [incriments of 0.1]
StepSize1 goes from 0.05 to 2 [increments of 0.05]
StepSize2 goes from 0.05 to 2 [increments of 0.05]
and you enter the following two (that’s it!) geogebra commands:
Sequence[If[abs(t – n StepSize) < 5, x² / (25 – (t – n StepSize)²) + (y – t + n StepSize)² / (1 – sgn(t – n StepSize) (t – n StepSize) / 5)² = 1], n, -5 / StepSize 2, 5 / StepSize 2, 1]
Sequence[If[abs(t – k StepSize2) < 5, (x – t + k StepSize2)² / (1 – sgn(t – k StepSize2) (t – k StepSize2) / 5)² + y² / (25 – (t – k StepSize2)²) = 1], k, -5 / StepSize2 (2), 5 / StepSize2 (2), 1]
Then you’re done! Well, you should animate the t-slider to make it cycle through everything without you having to drag the slider!
Seriously, two commands, that’s all it takes. But hopefully from the commands themselves you can understand why it would take me so long to figure out…


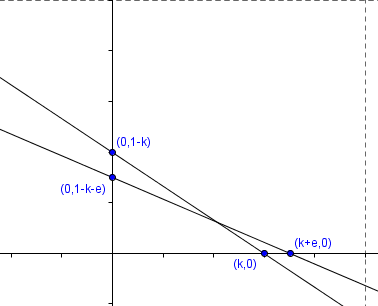
 units (and thus over on the x-axis
  units). Yes, we are going to have that tiny bit, that


 we get:


 or
or  .
. and plotting
  . Thus
  .*
.* , we have


 . Since
  must be positive.
