When I put out my call for help with Project Based Learning, I got a wonderful email from @gelada (a.k.a. Edmund Harriss of the blog Maxwell’s Demon) with a few things he’s done in his classes. And he — I am crossing my fingers tight — is going to put those online at some point for everyone. To just give you a taste of how awesome he is, I will just say that he was in NYC a few years ago and agreed to talk to my classes about what it’s like to be a real mathematician (“like, does a mathematician just like sit in a like room all day and like solve problems?”), and have kids think about and build aperiodic tilings of the plane.
Anyway, he sent me something about families of curves, and that got my brain thinking about how I could incorporate this in my precalculus class. Students studied function transformations last year in Algebra II, and we reviewed them and applied them to trig functions. But I kinda want to have kids have some fun and make some mathematical art.
First off, I should say what a family of curves is.

That’s from Wikipedia. A simple family of curves might be 

I made this in Geogebra with one command:
Sequence[k*x, k, -10, 10, 0.5]
This tells geogebra to graph 
Okay, pretty, but not stunning. Let’s mix things up a bit.

Sequence[k*x+k^2, k, -10, 10, 0.1]
Much prettier! And it came about by a simple modification of the geogebra command. Now for lines with a steep slope, they are also shifted upwards by 
Another one?
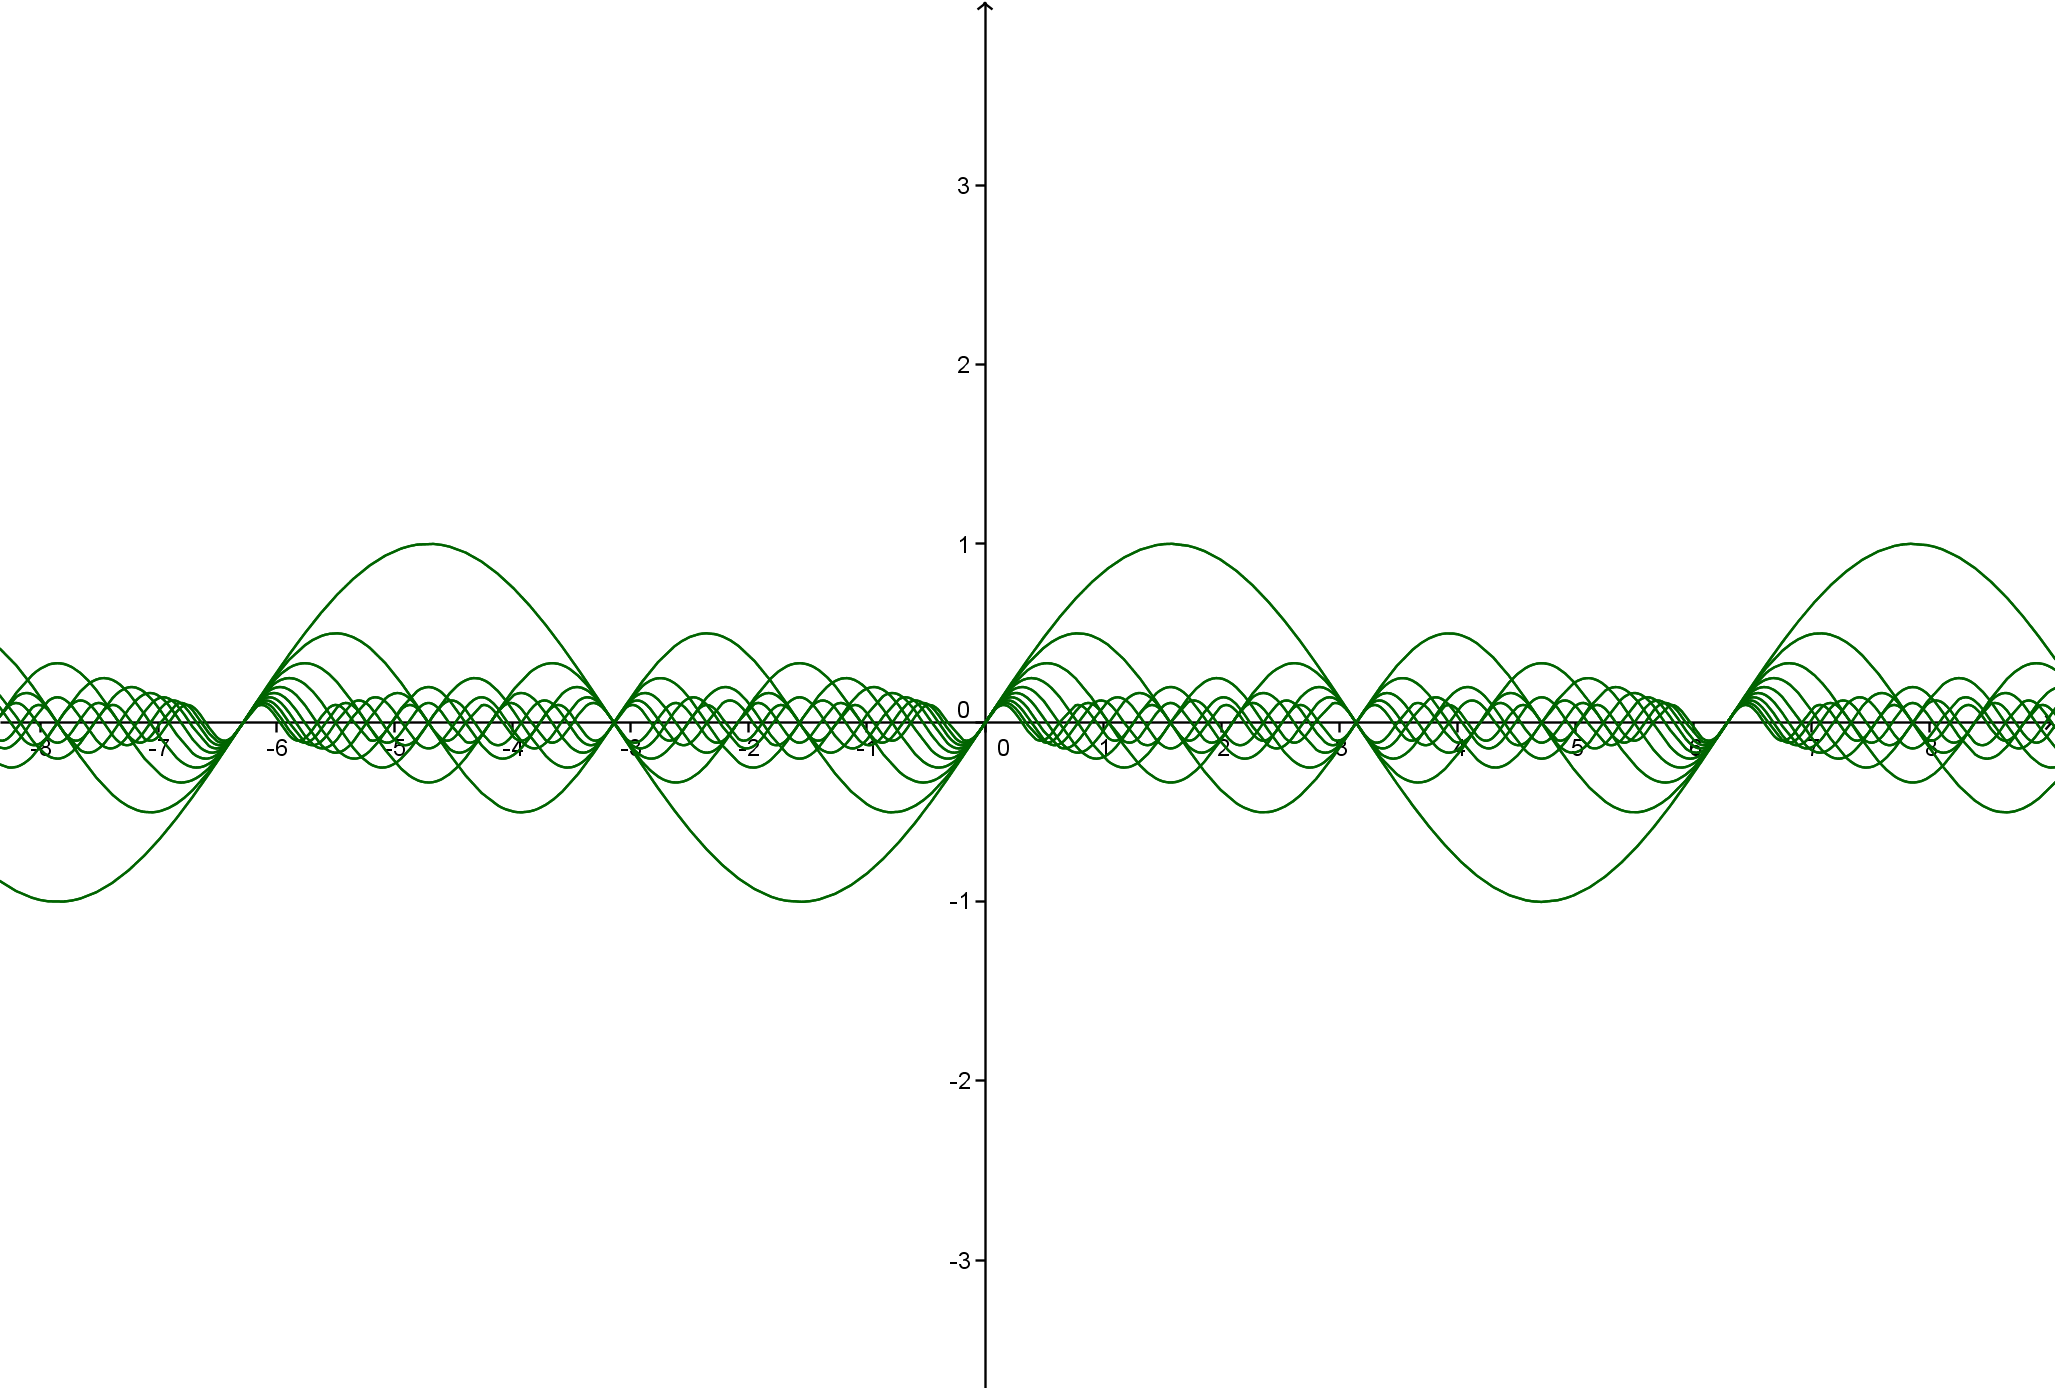
Sequence[1/k*sin(k*x),k,-10,10,0.2]
And finally, just one more…
Sequence[1/k*tan(x)+k,k,-10,10,0.1]
Just kidding! I can’t stop! One more!

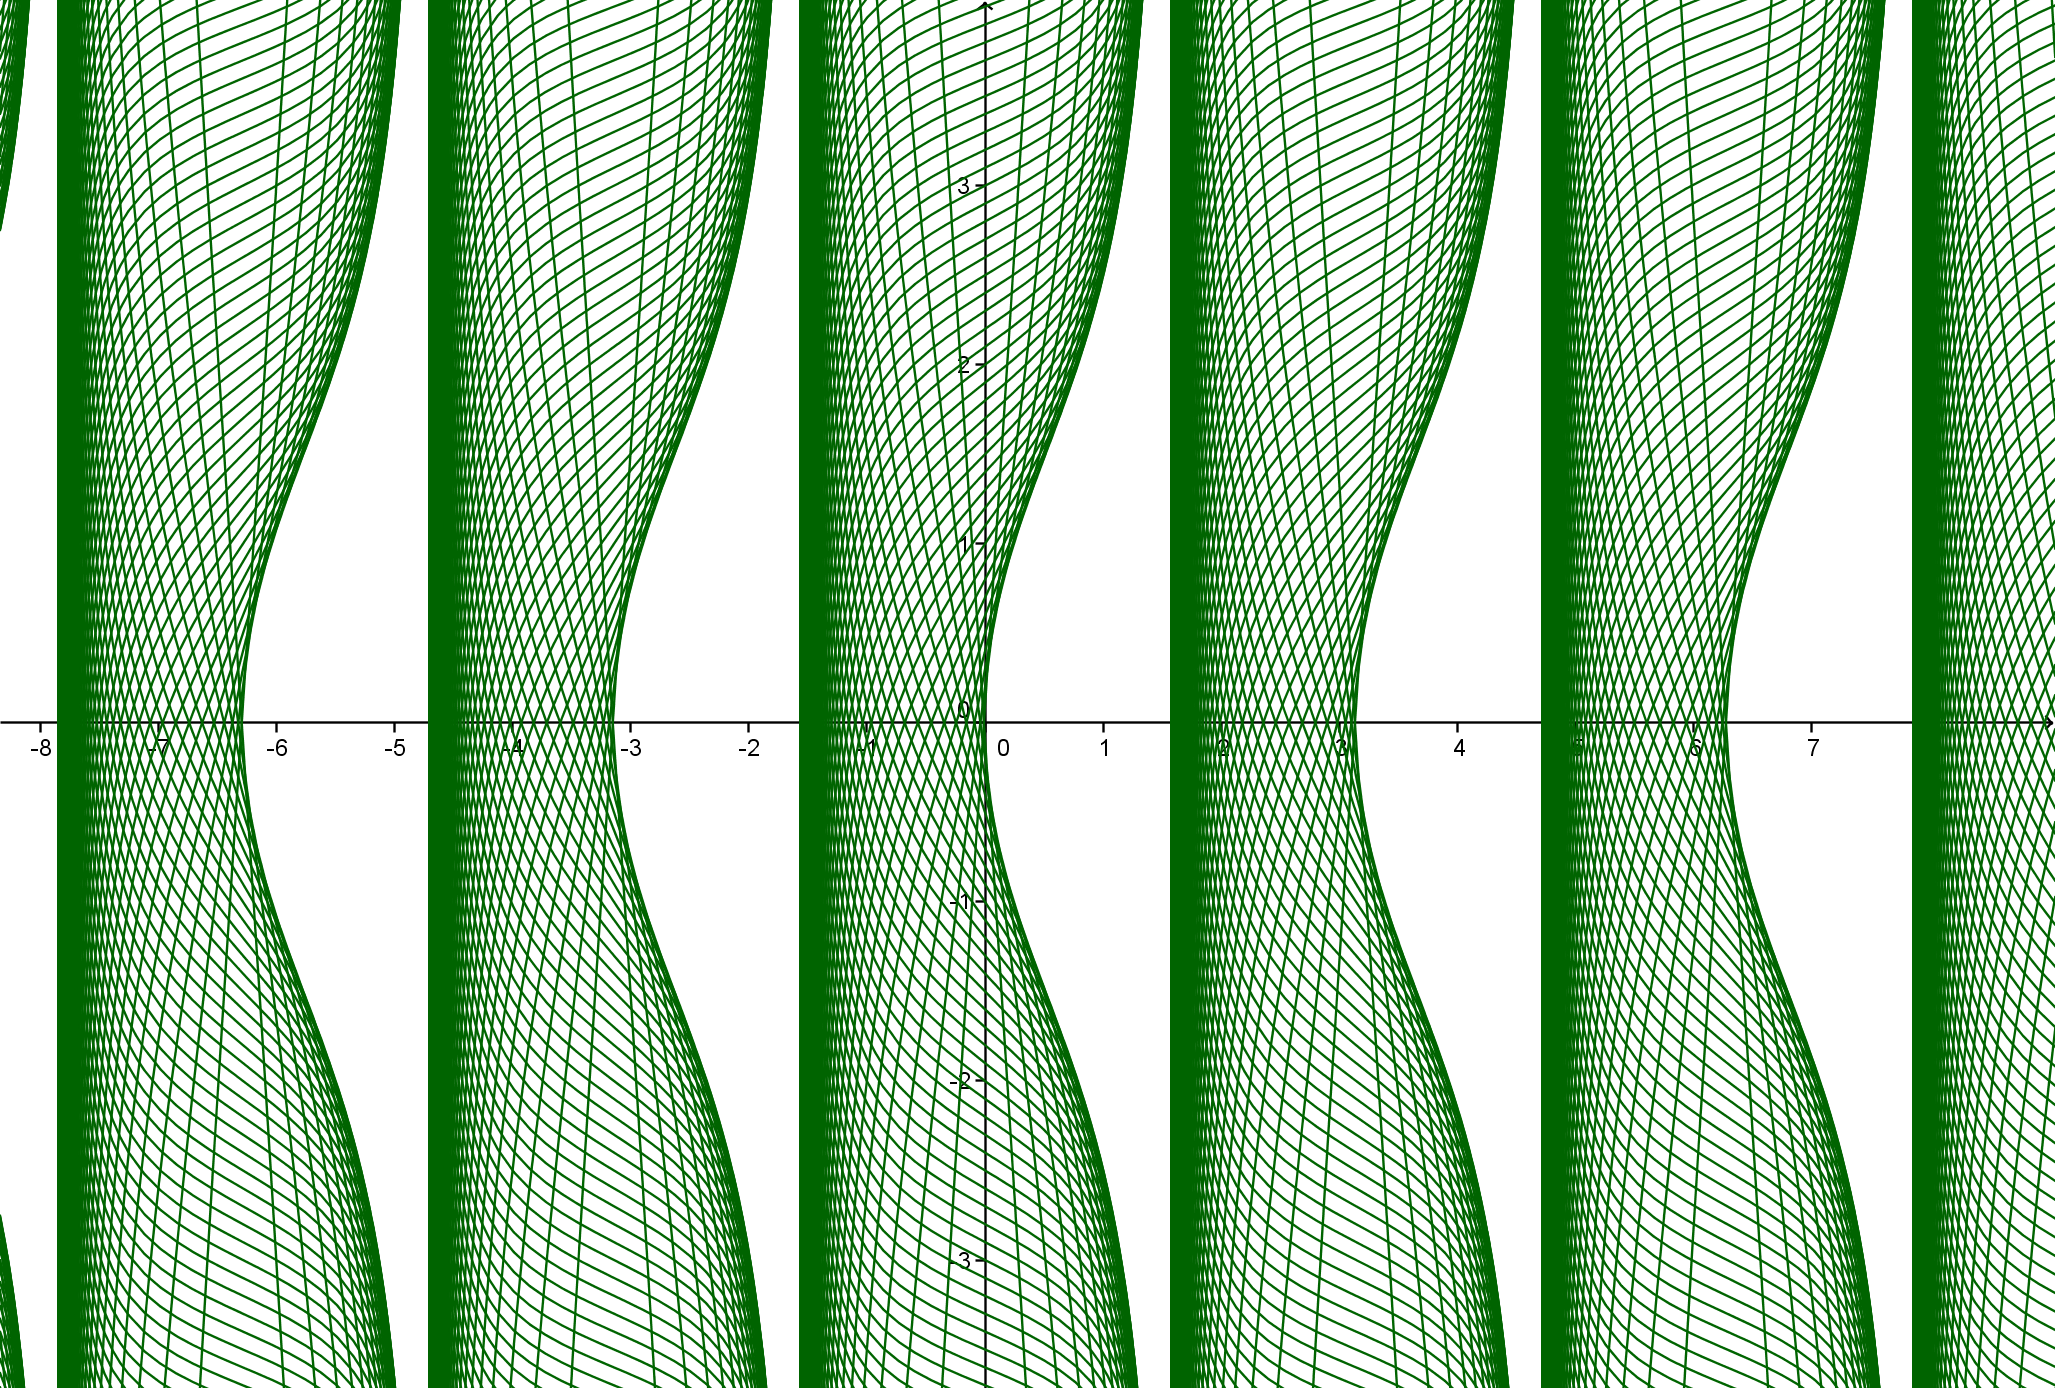
Sequence[k sec(x)+(1/k)*x,k,-10,10,0.25]
What I like about these pictures is…
THEY ARE PRETTY
THEY ARE FUN TO MAKE
THEY ARE SUPER EASY TO MAKE & TINKER WITH
THEY MAKE ME WANT TO MAKE MOAR AND MOAR AND MOAR
And then, if you’re me, they raise some questions… Why do they look like they do? What is common to all the curves (if anything)? Does something special happen when
You know what else is cool? You can just plot individual curves instead of the family of curves, and vary the parameter using a slider. Geogebra is awesome. Look at this .gif I created which shows the curves for the graph of the tangent function above… It really makes plain what’s going on… (click the image to see the .gif animate!)

Okay, so I’m not exactly sure what I’m going to do with this… but here’s what I’ve been mulling over. My kids know how to use geogebra. They are fairly independent. And I don’t want to “ruin” this by putting too much structure on it. So here’s where I’m at.
We’re going to make a mathematical art gallery involving families of curves.
1. Each student submits three pieces to the gallery.
2. Each piece must be a family of curves with a parameter being varied — but causing at least two transformations (so 

3. At least one of the three pieces must involve the trig function(s) we’ve learned this year.
4. The art pieces must be beautiful… colors, number of curves in the family of curves, range for the parameter, etc., must be carefully chosen.
Additionally, accompanying each piece must be a little artists statement, which:
0. Has the title of the piece
1. States what is going on with each curve which allows the whole family of curves to look the way they do, making specific reference to function transformations.
2. Has some plots of some of individual curves in the family of curves to illustrate the writing they’ll be doing.
3. Has a list of things they notice about the graph and things they wonder about the graph.
At the end, I’ll photocopy the pieces onto cardstock and make a gallery in the room — but without the artist’s names displayed. I’ll give each student 5 stickers and they’ll put their stickers next to the pieces they like the most (that are not their own). I’ll invite the math department, the head of the upper school, and other faculty to do the same. The family of curves with the most stickers will win something — like a small prize, and for me to blow their artwork into a real poster that we display at the school somewhere. And hopefully the creme de la creme of these pieces can be submitted to the math-science journal that I’m starting this year.
Right now, I have a really good feeling about this. It’s low key. I can introduce it to them in half a class, and give them the rest of that class to continue working on it. I can give them a couple weeks of their own time to work on it (not using class time). And by trying to suss out the family of curves and why it looks the way it does, it forces them to think about function transformations (along with a bunch of reflections!) in a slightly deeper way. It’s not intense, and I’ll make it simple to grade and to do well on, but I think that’s the way to do it.
What’s also nice is when we get to conic sections, I can wow them by sharing that all conics are generated by 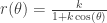
PS. Since I am not going to do this for a few weeks, let me know if you have any additional ideas/thoughts to improve things!

Note to self: Just had an idea about how this could be extended to calculus. Hello! Duh! We’re dealing with graphs and their shapes!
Bookmarking this activity for later. Love it. I’ll let you know how it goes. An aside, this would be a terrific tie-in with art.
This is an excellent post on using GeoGebra. I’m going to read this later. :-)
Amazing and fascinating. It touches the heart and stimulates the mind.
Great ideas here! What about asking students to try and replicate a couple of these without knowing the function used. Of course I am thinking about functions with which students are fairly familiar. Thanks for kickstarting my brain this morning.
Backwards thinking! For simple ones, that could be a really good Alg II or Precalc exercise!
Love love love this. Not sure why I never thought to do this in Geogebra. Thanks for sharing!!
This is awesome. Can you elaborate on your Calculus idea? because this is super cool and i would love to be able to use it this year.
Haha, honestly I tried to remember and I can’t! I think it had to do with differentiating with respect to , like how a slight change in the k value changes the y? Sorry I’m a doofus and can’t remember.
I love Geogebra art and have used it to show my students (they’re generally Algebra I or 8th grade, though sometimes Algebra II) the power of the variable. Another fascinating aspect to add is to use dynamic colors – the RGB triad can be varied with your slider or based on another parameter. (For example, put a point P on on of your curves and then let n=x(P) and alter the Red, Green and/or Blue value based on n. Sometimes you get muddy colors (if the R,G and B are close to each other) and sometimes you get some beautiful shades. Here’s a file I just created: http://www.geogebratube.org/student/m29129
Both your examples are SOOOO cool. I need to explore color more. Once I showed this family of curves thing to the geogebra expert in my department, he figured out a way to make colors too (but he had to use scripting). Here’s a gif (you might need to click on it): https://samjshah.com/?attachment_id=6174
Very nice! Do your students use scripting when they use Geogebra? I’m not good at it myself, and my students have never really seen me use it. I’m thinking about taking my Algebra I’s down to the computer room to make some line art this week now. Also, I’m about to do your Matrix Multiplication activity, introducing it with a food web then transitioning to a social network. Great ideas!
-Sue Russo
Quoting Continuous Everywhere but Differentiable Nowhere
Hi Sue,
No, they don’t know how to script. In fact, I don’t either — my colleague is the GGB expert and he is figuring all these cool things out. My kids are just learning how to graph, change axes, things like that. I recently realized we could do matrices in GGB, so maybe next year. I’m sad that we had to limit our matrix unit, because we didn’t get to do any of the fun stuff that you are doing!
Sam
I’m actually not a big fan of teaching matrices in Algebra 2 (or in high school, for that matter, when there’s so much other material we could cover, but this is the first year I’ve had any fun with them. Not sure if the kids are enjoying them, but I’m seeing them as less of a waste of time this year. If only we hadn’t had 2 snow days and so much frivolity (Spirit Week) recently – we could have made good progress. BUT we had “Penny Wars” and now I’m itching to have the kids figure out how many of each type coin each class turned in using a 5×5 system of equations!
Thanks again for the ideas. I’m looking foward to this week – not an easy thing to say in February.
-Sue
Quoting Continuous Everywhere but Differentiable Nowhere
Here’s an older file I created – honestly, I don’t remember how I did it at this point, but the colors are lovely and it’s one of my favorites. Not really directly related to a family of curves, but very pretty. http://www.geogebratube.org/student/m29134
This is brilliant. It gets explicitly at a really important conceptual leap: from “what does the graph of this function do?” to “what does the graph of this type of function do?”. Going from specific numbers to variables. But it does it in such a concrete, visually appealing way, that allows for experiment and keeps things from getting too abstract. I am so stealing this.
Here are 3 Valentine’s Day graphs I did today; we’d finished a chapter yesterday and are exploring matrices with Geogebra tomorrow; today I introduced them to animation and sliders and a little polar/parametric stuff: (strangely, 2 are called Valentine 1)
http://www.geogebratube.org/student/m29981
http://www.geogebratube.org/student/m29979
http://www.geogebratube.org/student/m29982
You might need to turn the animation on with a couple of them.
Sam! This is fantastic. Thanks for sharing this project in such a clear and enticing way. I love it!
Really like the idea! Noticed one typo, though. The conic function family should be r(theta) = 1/ (1+k cos(theta)).
Here’s a proof of that conic family: http://art-of-logic.blogspot.com/2014/09/conics.html. Really neat property! Thanks, Sam.
Here’s my own attempt at creating and collecting math art: https://math-as-art.blogspot.com.
I really love how you incorporated GeoGebra to do this! How did this work with your students?