Calculus

Quotes from Calculus

calculus quotes

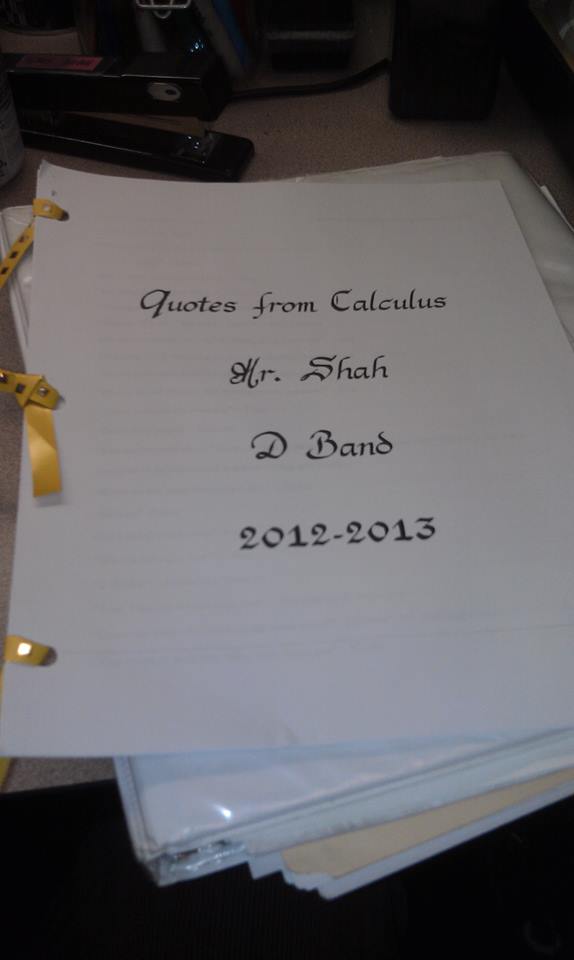
Seniors are done with classes. (The rest of the Upper School is preparing for final exams this week, and finals are administered next week.) Yesterday one of my calculus students gave me this 12-page booklet she prepared. All year, she had been writing down quotations from class — from students and from me. This was her final product. 

I don’t think it would be right to include the student quotations, but below here are some that are attributed to me. I remember some of them, and some of them I am clueless! Most of them won’t make any sense to you, gentle reader. Oh well!

“Derivatize!” — Mr. Shah

“Laughing is the only thing we can do, otherwise we would cry” — Mr. Shah

“Does this make the diddy [ditty] make more sense?” “P. Diddy” — Mr. Shah and Stu

“There’s still 2 minutes left, keep working” — Mr. Shah

“Fish, fish, fish, fish, fish, fish. 6 fish!” — Mr. Shah

“You can harangue him” — Mr. Shah

“It’s just depressing as a teacher when students admire clocks” — Mr. Shah

“I have 3 declarations, is that okay?” “No” — Student and Mr. Shah

“Sorry that you’re so sensitive” — Mr. Shah

“Anyone taking Latin here? Too bad. Ha! It’s in Greek.” — Mr. Shah

“Crust” — Mr. Shah

“”You need parentheses or else you’re gonna die” — Mr. Shah

“Oh no he didn’t!” — Mr. Shah

“Are you having special difficulties?” — Mr. Shah to Student

“Uh-uh boo boo” — Mr. Shah

“Jesus!” “Jesus!” “Hey, let’s keep religion out of this” — Student, Student, and Mr. Shah

“You’re a whack sharpener” — Mr. Shah to Student

“What if I put formaldehyde in this? And then spit in it?” — Mr. Shah to Student

“What’s the point in the spit? After the formaldehyde she’d already be dead” — Student

“That was my fault for listening to anyone but my brain” — Mr. Shah

“I have hearing” — Mr. Shah

“How was your weekend Mr. Shah?” *silence* “Oh, okay” — Student

“I got 99 problems and they’re all problematic” — Mr. Shah

“Who wants to volunteer to factor out these 100 terms?” *silence* “No one?” — Mr. Shah

“What… what’s the derivative of tan(x)?” “This isn’t happening” — Student and Mr. Shah

“Make your life easiah!” — Mr. Shah

“Yes sir” “I prefer your majesty” — Student and Mr. Shah

“Hey! Hey! Hey! This doesn’t sound mathy” — Mr. Shah

“Draw the boxes” “Why?” ” Because I order it” — Mr. Shah and Student

“When I see these things, I get like heart palpitations” — Mr. Shah

“Let’s come up with our own definition of genius” — Mr. Shah

“The baby mama rule, ugh! You guys have me calling it this instead of the inception rule” — Mr. Shah

“I pick one kid in every class to blame for everyone getting sick. I blame Student” — Mr. Shah

“Student die!” “Did you just tell Student to die?” “No I said duck!” — Mr. Shah and Student

“A long, long time ago… in a classroom right here” — Mr. Shah

“So what’s the derivative?” “With the letter? I can’t do it with letters” “Yo, pass it over here” — Mr. Shah, Student, and Student

“Doing it all at once is a little cray cray” — Mr. Shah

“We’re so close to being done” “We’re not done yet?” — Mr. Shah and Student

“Where is my pencil honey boo boo child” — Mr. Shah

“That’s bad news bears” — Mr. Shah

“Hush! No questions. We’re imagining” — Mr. Shah

“My favorite flowers are ranunculus” — Mr. Shah

“Do we have this sheet?” “Yes… but I don’t want you to take it out” “So how are we gonna do it?” — Student and Mr. Shah

“Do you have your phone in your hand?” “Never have I ever” — Mr. Shah and Student

“A baby, in a baby, in a momma” — Mr. Shah

“Student, I’m asking you this because you’re snarky” — Mr. Shah

“Derp!” — Mr. Shah

“What if I just say give me the Riemann Sum?” “You won’t” — Mr. Shah and Student

“Did I do well?” “No coach, you didn’t” — Student and Mr. Shah

“I put a little doo-hickey on the right side” — Mr. Shah

“I have a QQ Mr. Shah” — Mr. Shah

“Hush yourself child” — Mr. Shah

“Repetitious and tedious” — Mr. Shah

“Hey, fight me!” “Don’t tempt us” — Student and Mr. Shah

“Can’t you read it? More a exact!” — Mr. Shah

“He’s doing his thing” “What’s his thing?” “He’s running” “Attempting to run” — Student, Mr. Shah, and Student

“We should look at this and say…” “That ain’t right” — Mr. Shah and Student

“Holy Mother… Superior” — Mr. Shah

“They’re full of hogwash” — Mr. Shah

Advertisement

Some Random Things I Have Liked

The Concept of Signed Areas

In calculus, after first introducing the concept of signed areas, I came up with the “backwards problem” which really tested what kids understood. (This was before we did any integration using calculus… I always teach integration of definite integrals first with things they draw and calculate using geometry, and then things they do using the antiderivatives.)

I made this last year, so apologies if I posted it last year too.

[.d0cx]

Some nice discussions/ideas came up. Two in particular:

(1) One student said that for the first problem, any line that goes through (-1.5,-1) would have worked. I kicking myself for not following that claim up with a good investigation.

(2) For all problems, only a couple kids did the easy way out… most didn’t even think of it… Take the total signed area and divide it over the region being integrated… That gives you the height of a horizontal line that would work. (For example, for the third problem, the line y=\frac{2\pi+4}{7} would have worked.) If I taught the average value of a function in my class, I wouldn’t need to do much work. Because they would have already discovered how to find the average value of a function. And what’s nice is that it was the “shortcut”/”lazy” way to answer these questions. So being lazy but clever has tons of perks!

Motivating that an antiderivative actually gives you a signed area

I have shown this to my class for the past couple years. It makes sense to some of them, but I lose some of them along the way. I am thinking if I have them copy the “proof” down, and then explain in their own words (a) what the area function does and (b) what is going on in each step of the “proof,” it might work better. But at least I have an elegant way to explain why the antiderivative has anything to do with the area under a curve.

Note: After showing them the area function, I shade in the region between x=3 and x=4.5 and ask them what the area of that bit is. If they understand the area function, they answer F(4.5)-F(3). If they don’t, they answer “uhhhhhh (drool).” What’s good about this is that I say, in a handwaving way, that is why when we evaluate a definite integral, we evaluate the antiderivative at the top limit of integration, and then subtract off the antiderivative at the bottom limit of integration. Because you’re taking the bigger piece and subtracting off the smaller piece. It’s handwaving, but good enough.

Polynomial Functions

In Precalculus, I’m trying to (but being less consistent) have kids investigate key questions on a topic before we formal delve into it. To let them discover some of the basic ideas on their own, being sort of guided there. This is a packet that I used before we started talking formally about polynomials. It, honestly, isn’t amazing. But it does do a few nice things.

[.docx]

Here are the benefits:

  • The first question gets kids to remember/discover end behavior changes fundamentally based on even or odd powers. It also shows them that there is a difference between x^2 and x^4… the higher the degree, the more the polynomial likes to hang around the x-axis…
  • The second question just has them list everything, whether it is significant seeming or not. What’s nice is that by the time we’re done with the unit, they will have a really deep understanding of this polynomial. But having them list what they know to start out with is fun, because we can go back and say “aww, shucks, at the beggining you were such neophytes!”
  • It teaches kids the idea of a sign analysis without explaining it to them. They sort of figure it out on their own. (Though we do come together as a class to talk through that idea, because that technique is so fundamental to so much.)
  • They discover the mean value theorem on their own. (Note: You can’t talk through the mean value theorem problem without talking about continuity and the fact that polynomials are continuous everywhere.)

The Backwards Polynomial Puzzle

As you probably know, I really like backwards questions. I did this one after we did  So I was proud that without too much help, many of my kids were really digging into finding the equations, knowing what they know about polynomials. A few years ago, I would have done this by teaching a procedure, albeit one motivated by kids. Now I’m letting them do all the heavy lifting, and I’m just nudging here and there. I know this is nothing special, but this course is new to me, so I’m just a baby at figuring out how to teach this stuff.

[.docx]

Related Rates, Yet Another Redux

I posted in 2008 how I didn’t actually find related rates all that interesting/important in calculus. The problems that I could find were contrived, and I didn’t quite get the “bigger picture.” In 2011, I posted again about something I found from a conference that used Logger Pro, was pretty interesting, and helped me get at something less formulaic.

I still don’t know how I feel about related rates. I’m torn. Part of me wants to totally eliminate them from the curriculum (which means I can also possibly eliminate implicit differentiation, because right now I see one of the main purposes of implicit differentiation is to prime students for related rates). Part of me feels there is something conceptually deeper that I can get at with related rates, and I’m missing it.

I still don’t have a good approach, but this year, I am starting with the premise that students need to leave with one essential truth:

Often times, as we change one thing, it affects a number of other things. However, the way that the other things are affected can vary greatly. 

Right now, to me, that’s the heart of related rates. (To be honest, it took some conversation with my co-teacher before we were able to stumble upon this essential understanding.)

In order to get at this, we are starting our related rates unit with these two worksheets. A nice bonus is that it gets students to think about the shape of a graph, which is what we’ll be embarking on next.

The TD;DR for the idea behind the worksheets: Students study a circle which has it’s radius increase by 1 cm each second, and see how that changes the area and circumference. Then students study a circle which has it’s area increase by 10 cm^2 each second, and see how that changes the radius and circumference. The big idea is that even though one thing is changing, that one thing affects a number of different things, and it changes them in different ways.

[.docx] [.docx]

(A special thanks to Bowman for making the rocket and camera problem dynamic on Geogebra.)

It’s not like this is a deep investigation or they come out knowing anything super special. But the main takeaway that I want them to get from it becomes pretty apparent. And what’s really powerful (for me, as a teacher trying to illustrate this essential understanding) is seeing the graphs of how the various thing change.

***

IMAG2906

I had students finish the first packet one night. Before we started going over it, or talking about it, I started today’s class asking for a volunteer to blow up balloons. (We got a second volunteer to tie the balloons.) While he practiced breathing even breaths, I tied and taped an empty balloon to the whiteboard.

Then I asked our esteemed volunteer to use one breath to blow up the first balloon. Taped it up. Again, for two breaths. Taped. Et cetera until we got a total of six balloons taped.

Then I asked what things are measurable in the balloons.

Bam. List.

(We should have listed more. Color. What it’s made of. Thickness of rubber.]

Then I asked what we did to the balloon.

Added volume. A constant volume (ish) in each balloon.

Which of the other things changed as a result?

How did they change?

This five minute start to class reinforced the main idea (hopefully). We changed one thing. It changed a bunch of other things. But just because one thing changed in one particular way doesn’t mean that everything changed in that same way. For example, just because the volume increased at a constant rate doesn’t mean the radius changed at a constant rate.

***

 This is about all I got for now. I’m going to teach the rest of the topic the way I always do. It’s not up to my personal standards, but I still am struggling to get it there. I suppose to do that, I’ll have to see a more nuanced bigger picture with related rates, or find something that approaches what’s happening more visually, dynamically, or conceptually.

PS. The more I mull it over, the more I think that geogebra has to be central to my approach next year… teaching students to make sliders to change one parameter, and having them develop something that dynamically illustrates how a number of other things change. And then analyzing how those things change graphically and algebraically.

(A simple example: Have a rectangle where the diagonal changes length… what gets affected? The sides, the angle between the diagonal and the sides of the rectangle, the area, the perimeter, etc. How do each of these things get affected as the diagonal changes?)

What does it mean to be going 58 mph at 2:03pm?

That’s the question I asked myself when I was trying to prepare a particular lesson in calculus. What does it mean to be going 58 mph at 2:03pm? More specifically, what does that 58 mean?

You see, here’s the issue I was having… You could talk about saying “well, if you went at that speed for an hour, you’d go 58 miles.” But that’s an if. It answers the question, but it feels like a lame answer, because I only have that information for a moment. That “if” really bothered me. Fundamentally, here’s the question: how can you even talk about a rate of change at a moment, when rate of change implies something is changing. But you have a moment. A snapshot. A photograph. Not enough to talk about rates of change.

And that, I realized, is precisely what I needed to make my lesson about. Because calculus is all about describing a rate of change at a moment. This gets to the heart of calculus.

I realized I needed to problematize something that students find familiar and understandable and obvious. I wanted to problematize that sentence “What does it mean to be going 58 mph at 2:03pm?”

And so that’s what I did. I posed the question in class, and we talked. To be clear, this is before we talked about average or instantaneous rates of change. This turned out to be just the question to prime them into thinking about these concepts.

Then after this discussion, where we didn’t really get a good answer, I gave them this sheet and had them work in their groups on it:

I have to say that this sheet generated some awesome discussions. The first question had some kids calculate the average rate of change for the trip while others were saying “you can’t know how fast the car is moving at noon! you just can’t!” I loved it, because most groups identified their own issue: they were assuming that the car was traveling at a constant speed which was not a given. (They also without much guidance from me discovered the mean value theorem which I threw in randomly for part (b) and (c)… which rocked my socks off!)

As they went along and did the back side of the sheet, they started recognizing that the average rate of change (something that wasn’t named, but that they were calculating) felt like it would be a more accurate prediction of what’s truly going on in the car when you have a shorter time period.

In case this isn’t clear to you because you aren’t working on the sheet: think about if you knew the start time and stop time for a 360 mile trip that started at 2pm and ended a 8pm. Would you have confidence that at 4pm you were traveling around 60 mph? I’d say probably not. You could be stopping for gas or an early dinner, you might not be on a highway, whatever. But you don’t really have a good sense of what’s going on at any given moment between 2pm and 8pm. But if I said that if you had a 1 mile trip that started at 2pm and ended at 2:01pm, you might start to have more confidence that at around 2pm you were going about 60 mph. You wouldn’t be certain, but your gut would tell you that you might feel more confident in that estimate than in the first scenario. And finally if I said that you had a 0.2 mile trip that started at 2pm and ended at 2:01:02pm, you would feel more confident that you were going around 72mph at 2pm.

And here’s the key… Why does your confidence in the prediction you made (using the average rate of change) increase as your time interval decreases? What is the logic behind that intuition?

And almost all groups were hitting on the key point… that as your time interval goes down, the car has less time to fluctuate its speed dramatically. In six hours, a car can change up it’s speed a lot. But in a second, it is less likely to change up it’s speed a lot. Is it certain that it won’t? Absolutely not. You never have total certainty. But you are more confident in your predictions.

Conclusion: You gain more certainty about how fast the car is moving at a particular moment in time as you reduce the time interval you use to estimate it.

The more general mathematical conclusion: If you are estimating a rate of change of a function (for the general nice functions we deal with in calculus), if you decrease a time interval enough, the function will look less like a squiggly mess changing around a lot, and more and more like a line. Or another way to think about it: if you zoom into a function at a particular point enough, it will stop looking like a squiggly mess and more and more like a line. Thus your estimation is more accurate, because you are estimating how fast something is going when it’s graph is almost exactly a line (indicating a constant rate of change) rather than a squiggly mess.

I liked the first day of this. The discussions were great, kids seemed to get into it. After that, I explicitly introduced the idea of average rate of change, and had them do some more formulaic work (this sheet, book problems). And then  finally, I tried exploiting the reverse of the initial sheet. I gave students an instantaneous rate of change, and then had them make predictions in the future.

It went well, but you could tell that the kids were tired of thinking about this. The discussions lagged, even though the kids actually did see the relationships I wanted them to see.

My Concluding Thoughts: I came up with this idea of the first sheet the night before I was going to teach it. It wasn’t super well thought out — I was throwing it out there. It was a success. It got kids to think about some major ideas but I didn’t have to teach them these ideas. Heck, it totally reoriented the way I think about average and instantaneous rate of change. I usually have thought of it visually, like

But now I have a way better sense of the conceptual undergirding to this visual, and more depth/nuance. Anyway, my kids were able to start grappling with these big ideas on their own. However, I dragged out things too long. We spent too long talking about why we have to use a lot of average rates of changes of smaller and smaller time intervals to approximate the instantaneous rate of changes, instead of just one average rate of change over a super duper small time interval. The reverse sheet (given the instantaneous rate of change) felt tedious for kids, and the discussion felt very similar. It would have been way better to use it (after some tweaking) to introduce linear approximations a little bit later, after a break. There were too much concept work all at once, for too long a period of time.

The good news is that after some more work, we finally took the time to tie these ideas all together, which kids said they found super helpful.

Advice from Calculus Students Past, Informing the Calculus Student Present

I’ve done Standards Based Grading in Calculus for two years now. This is the start of my third year.

One of the things I have my kids do at the end of each school year (not just in calculus, but in all my classes) is to write a letter to themselves. But in the past. Yes, I tell kids to compose a letter that can be sent back into time, to them, at the beginning of the year. Things they wish they had known at the start of the year that they know now that it is the end of the year. And I let them know whatever they write is up to them, and that I don’t look at this until way into the summer. We seal them up.

I usually share these letters with kids the following year. When I do, I ask kids to think about commonalities they noticed in the advice from students, and also, if anything struck them. We have a conversation about that. I definitely emphasize that what works for one person might not work for another.

Without further ado, here is the advice that my 2011-2012 calculus kids wrote to their past selves, which I will be sharing with my 2012-2013 calculus kids.

To me, the major commonalities are… advice to do their homework even though it’s not graded, not to use reassessments as a crutch because it’s to your benefit to learn things the first time around, and to ask for help from colleagues and Mr. Shah.

With that, I’m out like a light.

Wealth Inequality! A Calculus Investigation

First off, I want to say that I took this wholesale from the North Carolina School of Science and Math.  Thank you NCSSM. They have a conference each year on high school math, and each time I’ve gone, the speakers I’ve liked best are the actual teachers at the school. So any good things you might want to say about this, please don’t say them to me. This is the product of the hardworking teachers over there. So please, please check out the NCSSM project here. All I will be doing in this post is talking about how I coopted it for my classroom.

So the year came to a close in my calculus class. And in the last week, I wanted to try something new. And there was a confluence of things that led me to this.

I had students teach themselves how to find the area of two curves previously, when I was out sick, but then I didn’t do anything with it. I had also just seen an interesting piece on wealth inequality which piqued my interest. And I had heard of the Gini Index and the Lorenz curve before but had never pursued it seriously.

So here we are, the perfect time to go whole hog. And when doing my massive internet search, I came across NCSSM’s awesome activity and realized it was better than anything I could devise on my own. I really loved the scaffolding of the packet.

To start out class, I laid out the objective. I showed some photos from Occupy Wall Street. We read the protester’s posters aloud. And we focused on one of them: “This is not the world our parents wanted for us, nor the one we want for our kids.” I focused on that, because it implied that there was a difference in the world from the previous generation. The protester, and others, have been saying that the rich are getting richer while the rest of us are not. And my question to the class is: do you think this is true?

We talked about it generally, and I followed it up with a conversation about how we might decide if the distribution of wealth were different now than it was later. Students shared their thoughts in pairs, and they came up with some good ideas. Many pairs talked about making a histogram (wealth vs. number of people with that wealth). Others talked about comparing the top 5% with the bottom 5%. We shared our ideas as a class. I liked making them think about how one might decide this, because the answer is: there are many ways, but they all are going to involve math. We also talked about how we could compare one wealth distribution to another — and then we realized that it became tricky, fast.

I then had them make conjectures on the actual distribution of wealth in the US. And then I showed them the true answer. The true distribution shocked them.

The best part of the discussion was around what kids picked for “what they would like it to be.” We got to talk about capitalism and socialism and oligarchies. I made it really clear that I wasn’t here to make a case for one type of economic system or another. (Though some students had some strong opinions of their own.)

This initial prelude set up the remaining 2 days kids spent working on this. It gave them our overarching question (“Is income truly becoming more and more unequally distributed in the past 40 years? Or is it propaganda used by Occupy Wall Street protesters and sensational journalists?”) And off then went.

I basically made the most minor revisions to the NCSSM document and gave it to my class…

Each day, I had a goal that students had to reach, and if they didn’t they were asked to finish it at home. (At most, they only had 5 minutes of work each night. It was the last week of classes, and I wanted it to be more relaxed.) We talked at the start of each class, and I had them work in pairs. We had mini breaks/discussions to talk about big ideas. One of these included the trapezoidal rule. When introducing Riemann Sums a month or two prior, we only did them as left and right handed rectangles. But we saw how bad those approximations would be in this case where we only had 5 divisions… which necessitated the use of the trapezoidal rule. I didn’t teach my kids it, but they could do it. And some found a quicker formula to find the area, because they got sick of calculating all the areas of the trapezoids together. Huzzah! One student make a calculator program to calculate the Gini Index because it became tedious to do the calculations.

We ended the packet by just going through the US Gini Indexes for the last 40 years. We didn’t do the part asking for an investigation on other countries.

Results

We did this informally. I threw it together, I framed it in the context of Occupy Wall Street, and we went off. I didn’t collect formal feedback from my students on this (it was the last week), but I had a number of students individually let me know how much they liked it. A couple told me it was their favorite thing all year — and they loved that this had applications. One told me they spoke with an economist last summer and they were talking about economics and calculus, and the economist was talking about the Lorenz curve — but the student (at the time) didn’t understand it. I love that we could clear that up!

Also, I had two teachers observe my class the first day we started it, and I had them participate, and they said they enjoyed thinking about the questions and working on the packet.

Using This in the Future

I love the idea of using this in the future. I hope to do so next year, earlier in the year. I think I need to make the packet a little more conceptually deep, and ask some probing questions as we go along.

One type of probing question might be to ask students to draw figure out what a Lorenz curve looks like for the Gini Index to be 0 and what a Lorenz curve looks like for the Gini Index to be 1 (the packet just tells them that). Or to explain why the Lorenz curve cannot go above the line y=x. In other words, why it can’t look like:

I also think it could easily be extended to be a good poster project. One obvious idea is having students pick two countries, do a little research on them and come up with a hypothesis for which has more income inequality and justify it without mathematics. Then they would calculate the Gini Index for each. Finally they would make a poster showcasing their hypothesis and their findings.

Additionally, I could have each of them (after our in class work) read the section in the book on the Trapezoidal Rule, and make part of their poster explain this rule and how it works for any general function divided into N equally spaced rectangles. (Since I don’t formally teach it, nor do I think it needs to be formally taught.)

Alternatively, I could have students (especially since we analyzed a program which calculated Riemann Sums) see if they could come up with a program that would calculate the Gini Index.

As a personal note for next year: Oh yeah, I have to remember to make a distinction between wealth inequality and income inequality. I kept conflating the two, but they are very different and I need to make sure I get that across.

Algebra Bootcamp in Calculus

So it was the Old Math Dog who pointed out that I never wrote a post explaining how I deal with the issue of kids not knowing basic algebra in calculus. I started this practice two years ago (when I also started standards based grading) and I have seen a remarkable difference in how my classes go from my life pre-bootcamps to my life post-bootcamps…

An issue in any calculus course — and I don’t care if you’re talking about non-AP Calculus or AP Calculus — is the student’s algebra skills. They might see \frac{1}{4}x+\pi x -4=0 and have no idea how to solve that. Or they might not know how to find \tan(\pi/6). Or they might cancel out the -1s in \frac{x^2-1}{x-1} to get \frac{x^2}{x}. It depends on where they are coming from, but I can pretty much guarantee you that every calculus teacher says the same thing to their classes on the first day:

Calculus is easy. Algebra is hard.

In my first three years of teaching calculus, I started with how all the books started, and all my calculus teacher friends started: a precalculus review. Then we went into limits.

The problem with that is that we might review some basic trigonometry, and then we wouldn’t see it again for months. And by then, they had forgotten it. And who could blame them. The precalculus review unit at the beginning of the course wasn’t working.

As I transitioned into Standards Based Grading, I looked at everything I taught really closely, and I honed in on the particular skills/concepts I was going to be testing. And since I’d taught calculus for a number of years prior, I knew exactly where the algebra sticking points were. Thus was born The Algebra Bootcamp.

Before our first unit on limits, I carefully analyzed what things I needed students to know to understand limits to the depth I required. I then looked at all the skills and thought of all the algebraic things, and all the old concepts, they would need in order to understand limits. And from that, I crafted an algebra bootcamp, and I made SBG skills out of just those limited skills.

For example, here was our first bootcamp (which, admittedly, was longer than most of the others, because we were settling in and I was gauging where the kids were at):

and I did the same for other units… just the targeted prior knowledge that they tended to not know or struggle with…

Notice how they tend to be very concrete and specific? Like “rationalize the numerator” (because I knew we were going to be doing that when using the formal definition of the derivative) or “expand (x+h)^n using the binomial theorem. Very specific things that they should know that they are going to be using in the following unit. It’s kind of funny because it is a hodgepodge of little (and often unconnected) things, and they have no idea why we’re doing a lot of what we’re doing (why are we rationalizing the numerator? why are we doing the binomial theorem?) and I don’t tell them. I say “it’s our bootcamp… once training is over you’ll see why these tools are useful.”

It is called “bootcamp” because I am not reteaching it from scratch. I’m reviewing it, and I go through things quickly. I only do a few of them in the first quarter and maybe the start of the second quarter. By that point, we’ve done what we needed to do, and they die off.

The reason that this has been so effective for me is because students aren’t having to relearn old topics/algebraic skills while concurrently learning the ideas of calculus. We review these very specific things beforehand so that when we approach the calculus topics, the focus is not on the algebraic manipulation or remembering how to find the trig values of special angles or what a piecewise function is… but  on the larger picture…. the calculus.

Remember: calculus is easy, it’s the algebra which is hard.

So we took care of the algebra beforehand, so we can see how easy calculus is.

My kids in the past two years have made so many fewer mistakes, and we’ve been able to really delve into the concepts more, because I’m no longer fielding questions like “could you review how to do X?” Doing this has also forced me to think about what the purpose of calculus class is. The more I teach it, the more I take the algebraic stuff out and the more I put the conceptual stuff in. For example, I don’t use \cot(x), \sec(x), and \csc(x) in my course anymore  [1], because I wasn’t trying to test them on their knowledge of trigonometry. Doing these bootcamps coupled with standards based grading has forced me to keep my eye on what I really care about. Students deeply understanding the fundamental concepts of calculus. And I think you can do that without knowing how to integrate \sec(x)\tan(x) just fine. [2]

[1] With the exception of \sec^2(x) for the derivative of \tan(x).

[2] I teach a non-AP calculus, so I have this luxury. But it’s nice. Each year I strip more and more stuff off the course and add in more and more depth. And I am glad that I understand depth to mean something other than “more complicated algebra in the same old calculus problems.”