I just started reading Closed Chambers: The Rise, Fall, and Future of the Modern Supreme Court — and I came to an interesting case which could turn into a good problem dealing with exponential math.
A paraphrasing of the case
The case, originating in 1980, was filed by the U.S. Department of Justice and joined by the NAACP against the city of Yonkers, New York. The charge: violating the 1968 Fair Housing Act by purposely placing public housing in such a way as to perpetutation residential segregation. Finally, in 1985, the federal district court judge ruled in favor of the Department of Justice. However, with the ruling needed to come some sort of remedy — how could this wrong be righted?
The judge, Leonard Sand, ordered the city of Yonkers to build 200 public housing units spread throughout Yonkers, and to plan for subsidized housing in previously segregated neighborhoods. The city initially balked, but in January 1988, the city council formally agreed to the order. However, two weeks later, four of seven members of the city council decided to go back on their agreement, in defiance of the court.
Here’s where it gets interesting.
“Judge Sand first cajoled, then demanded, and finally threatened the city and its recalcitrant officials with contempt of course. As a last resort, Sand ruled that if the council did not adopt the necessary legislation by August 1, he would fine the city $100 a day, doubling every day until the legislation passed… In addition, he would fine each council member voting against the legislation $500 a day, with the possibility of incarceration after Day 10″ (page 40-41).
It wasn’t clear to me whether the fines would be cumulative or not (so if the fine after day 2 would be $200 or $200+$100), but from this New York Times article and others, I can say with a high degree of certainty that it was cumulative!
The fines were to start on August 2nd. However, they were suspended from August 9th to September 2th, while the case was waiting to be being heard by the appeals court and the supreme court.
The appeals court ruled that the exponentially increasing fine was excessive and unconstitutional. The ruling reads:
The City contends that the amount of the coercive fines imposed as a remedial sanction for civil contempt is excessive and a violation of the Due Process Clause of the Fifth Amendment and the Excessive Fines Clause of the Eighth Amendment. The fines start at $100 a day and double each day of continued noncompliance. As a result of doubling, the fine exceeds $100,000 for day 15, exceeds $1 million for day 21, and exceeds $1 billion for day 25.
Um… me thinks that even though it is a true statement that on day 15, the fine is more than $100,000, the justices probably meant day 11. Well, anyway, let’s continue:
The Court acted well within its discretion in starting the fine schedule at $100 a day. The Court also was entitled within reasonable limits to double the amount of the fine for each day of continued defiance. At that rate the cumulative fine after seven days, when we issued our stay, was $12,700. At some point, however, the doubling reaches unreasonable proportions. Under the current schedule the fine for day 25 is more than $1 billion; the fine for day 30 is more than $50 billion.
We believe that the doubling exceeds the bounds of the District Court’s discretion when the level of each day’s fine exceeds $1 million. The present schedule calls for a fine of more than $800,000 on day 14. We will therefore modify the contempt sanction against the City to provide that the fine shall be $1 million per day on day 15 and $1 million per day for every subsequent day of noncompliance.
So instead of having the fines double each day, after the doubling reached $1 million, each subsequent day, the fine would be another million bucks. The U.S. Supreme Court got the case in 1988 and decided not to grant a stay (meaning they didn’t want to put the Court of Appeals ruling on hold). In other words, the fines imposed by the Court of Appeals were constitutional and enforceable!
Even with the “reduced” fine, the city of Yonkers started to feel the pinch…
Mr. DeLuca [the city manager] has estimated that the city could pay fines through day 79, when the total would exceed the $66 million the city has in available resources… [NYT article].
On September 8, the New York Times ran an article about the drastic measures that Yonkers was about to be forced to take, since the contempt fines were nearing $1 million. By November 5th, the city would have to layoff 1,605 employees, leaving only 348 critical employees needed for minimal public safety and health! The article, rightly titled “‘Doomsday’ Layoffs Plan Adopted for Yonkers” continues:
According to the city schedule, ”all city services would be phased out after 12 weeks, on Thanksgiving Day, Nov. 24, 1988.” Under the state plan, the city would be operating under an emergency austerity program by Nov. 5, with the money saved available to ”retain a small work force” that would provide ”minimal public health and safety.”
Mr. DeLuca circulated a notice this evening to all employees, saying that they would be ”informed in writing as to your scheduled layoff date with as much notice as possible.” Employees would also be informed of their rights regarding unemployment insurance and options to continue benefit plans at their own cost.
”A final ‘Doomsday Plan’ will be in effect by Thursday morning,” Mr. DeLuca wrote. ”I regret to inform you this is not a rumor.”
Two days later, two of the four city council members who were defying the court order relented. The vote had switched, from 3-4 to 5-2. The first round of layoffs, scheduled in a matter of days, was averted.
Approval of the housing plan means an end to the fines that threatened to bankrupt the city, with the last assessment recorded on Thursday. The money already paid, $1.6 million in checks made out to the U.S. Treasury, will not be returned.
The case was not officially closed until May 2007 — twenty seven years after it began — when Judge Sand finally ruled that the court order had been followed through.
SOME MATH ANALYSIS
I made a graph of how much Yonkers owed the government each day starting on August 2nd until they agreed to the court order on September 9th:
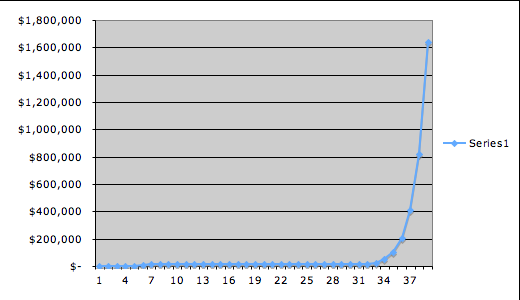
However, you can’t quite tell what’s going on for the first 30 days, because the scale is so large… And in general, when you’re plotting three or more orders of magnitude, you should plot on a log scale. So…
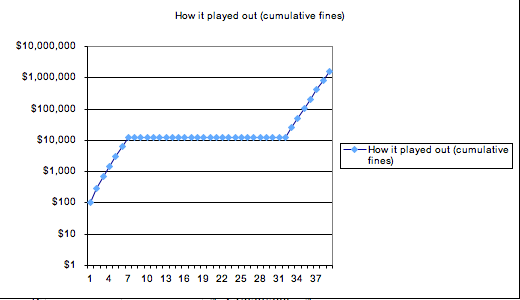
Notice the new scale (see the numbers on the left increase by an order of magnitude). It allows you to see more information. Like what’s that really long straight segment in the middle? Well, remember the fines were put on hold from August 9th to September 2nd, so the amount of money owed by Yonkers was kept constant for those days. That sort of “detail” got lost in the first graph, because the scale was so large!
And the first third of the graph looks linear, while it looked totally flat on the original non-log-scale graph. Why linear? Well, because remember the fines were doubling for all of those days, and when you plot exponential growth on a log scale, you get a line! But be careful! It isn’t exactly a line… We aren’t plotting $100, $200, $400, $800, etc., which would be perfectly exponential data. We are plotting the cumulative totals, which are $100, $300, $700, $1500, etc. These numbers don’t form a perfect exponential growth, though they are super duper close to being perfectly exponential! So for all intents and purposes, we can call it exponential, and hence, the first third of the graph is pretty darn linear. Since the last third of the graph still has the fines doubling and being added to the cumulative total, that section too is linear.
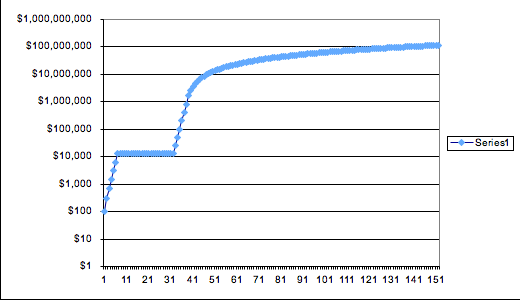
I also was really curious what would have happened if Yonkers didn’t pay up when they did… What if they let the fines accumulate until December 31st? Well, I also plotted that without and with a log scale…
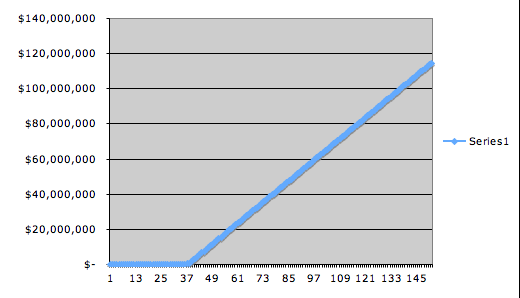
Looking at the first graph, we see that starting around day 37, we get a linear increase. Recall that’s because the Court of Appeals ruled that after the fines reached $1 million/day, they would stay $1 million/day. So each subsequent day, the fine just grows by the constant amount of $1 million.
(On the second graph, the log scale graph, we see the data go from linear to constant to linear — just like in our graph of what the town actually owed — but then the graph starts “slowing down” right at the same time the first graph becomes linear. That curve is actually logarithmic. Can you see why?)
My last hypothetical is: what if the Court of Appeals and the Supreme Court didn’t find the doubling fine unconstitutional. What would that graph look like if extended to December 31st? Plotted on a log scale, we get:
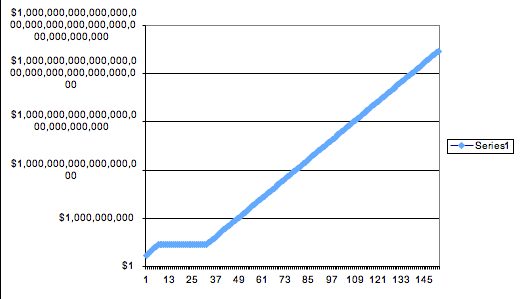
On December 31st, Yonkers would have owed the federal government: $17,014,118,346,046,900,000,000,000,000,000,000,000,000.
And as of the writing of this post, the national debt is only about $9,500,000,000,000.
YIKES! Good for the paying off the national deficit, bad for Yonkers.
A timeline for the case’s initial unfolding was published in the NYT here:
- Dec. 1, 1980: Justice Department sues Board of Education, City of Yonkers and Yonkers Community Development Agency, charging that the city racially discriminated in education and public housing.
- Dec. 1, 1980: Justice Department sues Board of Education, City of Yonkers and Yonkers Community Development Agency, charging that the city racially discriminated in education and public housing.
- Nov. 20, 1985: Judge Leonard B. Sand of Federal District Court in Manhattan rules that Yonkers’s housing and schools were intentionally segregated by race. A housing remedy order directs the city to build 200 units of public housing and to plan additional subsidized housing.
- Jan. 28, 1988: City Council approves consent decree that sets timetable for building 200 units of public housing and commits city to an additional 800 subsidized units.
- July 26: Court sets Aug. 1 deadline for Council to adopt zoning amendment needed to build the 800 units.
- Aug. 1: Council rejects amendment in a 4-to-3 vote.
- Aug. 2: Judge Sand finds city and the four Councilmen who voted against the amendment in contempt of court and imposes fines. The city’s fines start at $100 and double every day. The Councilmen are fined $500 a day.
- Aug. 9: The fines are suspended by a Federal appeals panel while the contempt ruling is appealed.
- Aug. 26: An appeals panel upholds contempt ruling and fines, but fines against the city are capped at $1 million a day. The fines remain suspended so the city can appeal to the United States Supreme Court. Sept. 1: The Supreme Court refuses to grant the city a further suspension of fines but does continue the stay of fines against the Councilmen so they can seek the High Court’s review of their contempt rulings.
- Sept. 2: Judge Sand reinstates the fines against the city.
- Sept. 5: Mayor Nicholas C. Wasicsko meets for 7 1/2 hours with the City Council in an effort to end the impasse, but no compromise is reached.
- Sept. 6: The Westchester District Attorney decides not to prosecute the four Councilmen who voted against the plan.
- Sept. 7: As contempt fines continue to build up, a state panel adopts a ”doomsday” plan to cut city services.
- Sept. 8: Fines pass the $1 million mark. As Yonkers residents confront layoffs and cuts in city services, pressure grows on the Mayor and the City Council to resolve the crisis. A City Council meeting over a transfer of funds to finance the fines erupts into a shouting match.
- Sept. 9: The City Council votes to accept the plan.
 ,
,  , and
, and  respectively (more fun solution)
 by letting each of the terms in the sum being a coefficient. Eventually, we want to find
  .
.


 and such), and using it to simplify the coefficients above, we get:
 will help. Because at least then we’ll have the same number for the exponents and the Fibonacci number!
 , we see that the RHS is really
  . (It has all the terms in
  .)
.) .
.
 . Since
  would decay at a different rate than
  increases. But it turns out that they both grow exponentially! (You can see that by looking at my previous post on the Fibonacci numbers and how to come up with a general equation for the nth term!). And so having one decay exponentially fast and the other grow exponentially fast end up “cancelingl” each other out. Which is a wishy-washy explanation as to why we can get such a beautiful convergence!
![X_0=[500 \hspace{12pt} 0]](https://s0.wp.com/latex.php?latex=X_0%3D%5B500+%5Chspace%7B12pt%7D+0%5D&bg=ffffff&fg=333333&s=0&c=20201002) which represented the [mayonaise, ketchup] initially. I also created a matrix
which represented the [mayonaise, ketchup] initially. I also created a matrix ![Y=[0 \hspace{12pt} 10]](https://s0.wp.com/latex.php?latex=Y%3D%5B0+%5Chspace%7B12pt%7D+10%5D&bg=ffffff&fg=333333&s=0&c=20201002) which represented how much [mayonaise, ketchup] I was adding at each iteration. I let
which represented how much [mayonaise, ketchup] I was adding at each iteration. I let  which is our “normalization” factor. (You’ll see…)
 which turns out to be
 ![X_1=[490.196 \hspace{12pt} 8.804]](https://s0.wp.com/latex.php?latex=X_1%3D%5B490.196+%5Chspace%7B12pt%7D+8.804%5D&bg=ffffff&fg=333333&s=0&c=20201002) . You see now what the
. You see now what the  does? It makes sure that we have 500 gallons total in the vat.
 which simplifies to
  .
. which simplifies to
  .
. .
.![k^nX_0=k^n[500 \hspace{12pt} 0]](https://s0.wp.com/latex.php?latex=k%5EnX_0%3Dk%5En%5B500+%5Chspace%7B12pt%7D+0%5D&bg=ffffff&fg=333333&s=0&c=20201002) to find out how much mayo is in the vat. (Note that since
to find out how much mayo is in the vat. (Note that since  doesn’t contribute to the mayo.)
 . So we have to solve the equation:
 .
. gallons of mayo. That brings you to the very last step, which is quickly solvable.
 represent the number of single and double burgers that Nortrom can eat. We know that these combinations are
  ,
,  ,
,  ,
,  ,
,  ,
,  ,
,  ,
,  ,
,  . Let’s see how many different ways that Nortrom can eat one of these combinations of single and double burgers.
 ways.
ways. .
. ,
,  ,
,  ,
,  ,
,  ,
,  ,
,  ,
,  ,
,  ,
,  ,
,  ,
,  ,
,  .
. .
. . This is because if you have 12 slots and you have to put double burgers in 5 of the slots, then the rest must be filled with single burgers.