Going into Rational Functions
My impression is that most people introduce rational functions by showing something like…
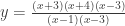
… and then spend the rest of the time asking kids some questions, like “what’s the x-intercept(s)?” “what’s the y-intercepts?” “what’s the vertical asymptotes?” And so from one big equation, you pull out all this individual stuff…
But from what I’ve seen when most kids approach rational equations, it is all very procedural. And every time I dug a little deeper to see what they truly understood about these equations, it became clear that a procedure to “solve” these questions was taking the place of understanding what was going on. So pay attention. You might recognize students don’t know what a hole truly is and why it appears in a graph… or they might not understand why vertical asymptotes appear… at least not on a deep level. The answers I have heard from kids are procedural, and rarely have any deep stuff underneath.
To counter this, I made two major changes to how I approach/introduce rational functions this year.
First, initially, I focus heavily on the graphical side of things. To the point where on the first day, students do not see a single equation, and are asked (entreated!) not to write a single equation down.
Second, I want kids to build up rational functions, instead of breaking them down. I want them to see how they are constructed term by term by term.
So for example, when we see the rational function listed above, we find it easier to view it as:
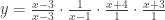
Kids need to understand what the first term is doing — not just “as a rule” but conceptually/graphically. I expect them to say that for any  value other than 3, the fraction will evaluate to be 1 (thus it will not affect the rest of the multiplication), but when is 3, we clearly get something undefined.
Kids need to understand that the second term is creating the function to blow up in a certain way at  . Not just because we’re dividing by zero so things go crazy and explode, but being able to articulate precisely why the function blows up. (The explanation I’m looking for says that at x-values closer and closer to 1, the denominator is getting smaller and smaller, but the numerator is staying at 1. Thus the output is getting bigger and bigger and bigger.)
And of course kids need to understand how the third and fourth terms are (graphically) creating x-intercepts in the final graph.
Of course once this is done, you can throw in the other stuff…
Here are my files in .doc form [Rational Fxns 1, Rational Fxns 2, Rational Fxns 3, Rational Fxns 4]
My Awesome Introduction
Although there are definitely ways I can improve this, here is how I started off rational functions. My goal — gentle reader, to remind you — is to do very little explaining and have the kids figure as much out on their own as they can. I felt wildly successful with this when it came to the introductory materials for rational functions.
It took my kids about a class period to do this first packet (they finished the rest up at home). I started with the admonition that no equations should be used and everything needed to be thought of graphically if it was going to be an effective exercise.
Out of this came nice discussions of holes and vertical asymptotes.
For their nightly work on the first day, I had kids finish this packet and then write down all the equations for each of the graphs.
The next day, we went through our answers, and started working on this, which they were crazy adept at doing:
Taking Things Further
I link to a couple more sheets I created above if you want to see what came after… how I introduced end behavior and horizontal asymptotes, and how I introduced graphing.
It wasn’t anything innovative, and could use a lot of work to refine it, but maybe you’ll find something you can work with?
The two things I did like that happened when going over this less basic stuff is:
(1) When kids make sign analyses, they don’t always understand why they are plotting the points they are plotting on the sign analysis. Why do they plot x-intercepts, holes, and vertical asymptotes? I like having my kids discuss why those particular graphical features, and then draw pictures of various graphs where the function does switch from positive to negative (or vice versa) at these points… and have kids draw pictures of various graphs where the function does not switch from positive to negative at these points. Kids, from this, start to understand that if we wanted a sign analysis, these special places (vertical asymptotes, holes, x-intercepts) are places we want to look… and they also start to understand that a function doesn’t necessarily have to change signs at these special places.
(2) I have found in the past that students find it challenging to go from a rational equation to a rational graph, without any scaffolding. So before throwing them in the deep end I like to give them sign analyses and end behaviors, and ask them to sketch a graph that matches the information we know. They start to think of it like a puzzle. Once they have practiced that a few times, they can start doing everything from an equation.
I wish I were less exhausted and could explain more. I literally passed out for a few seconds while typing the end of this post. However, check these lessons out. See if you might want to join me in switching up how we think about rational functions.
Update:
Some questions that you might want to bring up in your study of rational functions…
1. Why do we plot x-intercepts, vertical asymptotes, and holes on the number line when doing a sign analysis?
2. Why do you only have to test one number in each region in a number line… how do we know all the rest of the numbers in that region (when plugged into the equation) will result in the same sign?
3. What is a hole?
4. Why is a hole created? Why does the creation of a hole not affect the “rest” of the equation when it’s graphed?
5. Why do vertical asymptotes appear?
6. Why does the end behavior look like it does?
7. Why can rational function cross a horizontal asymptote and why can it not cross a vertical asymptote?
The key to all of these is why, and if kids can give a procedural answer (e.g. “A hole is created when you see the same factor in the numerator and denominator”) then you know you need to dig more and ask the next question (“so why does having the same factor in the numerator and denominator create a hole?”).


 would have worked.) If I taught the average value of a function in my class, I wouldn’t need to do much work. Because they would have already discovered how to find the average value of a function. And what’s nice is that it was the “shortcut”/”lazy” way to answer these questions. So being lazy but clever has tons of perks!
 and
and  and ask them what the area of that bit is. If they understand the area function, they answer
  . If they don’t, they answer “uhhhhhh (drool).” What’s good about this is that I say, in a handwaving way, that is why when we evaluate a definite integral, we evaluate the antiderivative at the top limit of integration, and then subtract off the antiderivative at the bottom limit of integration. Because you’re taking the bigger piece and subtracting off the smaller piece. It’s handwaving, but good enough.
 and
and  … the higher the degree, the more the polynomial likes to hang around the x-axis…