In my last post, I shared a question posed to me by a student. Essentially, it boiled down to: can we algebraically prove that the following will always be an integer?
I shared it with two friends in my department because they both really love combinatorics like me. One gave me some really nice ways to think about it and set me upon a nice path forward. But before I could go there, the other (the illustrious James Cleveland-Tran) shared with me his thinking. It was amazing. I wrote in my last post I love when things I can’t explain (in mathematics) feel like magic, because it means I get to learn something cool to figure out what makes it work. And when I do, when I understand something so well that the magic suddenly feels mundane (I think I used the word “obvious”), that is a wonderful moment. Because that means I fully grasp something. As James shared his thinking with me, I had that moment. Of course this had to be true. It doesn’t involve anything so deep I had to work to get it. It felt simple, and simply put, beautiful. I’m going to share that reasoning here.
So to start, I want to remind y’all that the things being factorialized and multiplied in the denominator all add up to the numerator. I am going to use a specific example to illustrate this and work through the ideas:
The whole proof hinges on this idea: a product of n consecutive integers will be divisible by n! Since James showed me this, I’ll refer to this as the James’ Theorem.
So let’s look at this example more closely. I’m going to expand out the numerator.
Now I’m going to group the numerator into groups of consecutive integers. Of course you can see we can do this in different ways. Here are some of them!
By James’ Theorem, we know the three consecutive blue numbers in the top of the fraction will evenly divide the 3! in the bottom of the fraction, the four consecutive red numbers in the fraction will evenly divide the 4! in the bottom of the fraction, and the five consecutive yellow numbers will evenly divide the 5! in the bottom of the fraction. And thus we’re done.
Now how do we know James’ Theorem is true?
Okay, I officially hate my life. GOSHDARNIT ALL TO HECK! As I was typing up the rest of this post, showcasing what I thought was a wonderful, deep, clear understanding of something that felt so obvious, I realized I don’t understand it fully. ACK!
And so, again, I’m in the realm of magic again. This isn’t the first time. This happens to me a lot with really interesting problems. I almost always discover a mistake in my reasoning when trying to write up an explanation with simplicity but also being comprehensive. And that’s exactly what happened here. (This is one reason why explaining my reasoning clearly to others is so important in my math process, and why I love kids talking about their mathematical thinking with others! It forces critical self-reflection.)
So here’s where we’re at. I do fully accept that if James’ Theorem is true, then we’re done! But I had a misconception that makes me feel a little embarrassed looking back at things.
I was thinking for each consecutive 5 integers, for example, had one of those integers divisible by 5, a different one had one of those integers divisible by 4, a different one had one of those integers divisible by 3, a different one had one of those divisible by 2, and the last remaining one had one divisible by 1.
Like I’m illustrating here:
But… yeah… that’s not always the case… Here’s the text I sent my friend James…
I’m now wondering about the factorial proof. I agree that if we know that the product of k consecutive integers were divisible by k!, the proof is done. But it’s not obvious to me anymore.
If we have the five numbers 27, 28, 29, 30, 31, I had convinced myself that one was divisible by 5, a different one was divisible by 4, a different one was divisible by 3, a different one was divisible by 2, and the last one was divisible by one. In my mind they had to be different ones. But that doesn’t work here.
And I thought they had to be different because in this case for example when they’re not, you then have to show after you divide one number out you might have to then divide a second number out and I don’t know why the second division necessarily works. Like in this example… after dividing out the 5 and the 4 and the 3… the 2 would have to divide into the 30 or 28. But the 28 already had 4 divided out so it wouldn’t be able to be divisible by 2 (what you’re left with is 7). And it feels magical that the 30, after being divided out by 5, happens to still then be divisible by 2.
In other words, how do I know the 2 will still be able to be divided into the 30 or 28?!?
Of course, I know with this specific example it can divide into the 30 (even after the 5 divides into the 30)… but how do I know if I did this with another set of n consecutive numbers, I wouldn’t hit a place where after you’ve divided out a bunch of numbers, you’re left with a number in the denominator that won’t go into the numerator?
Here’s my current state of things. I believe James’ Theorem and know it will unlock this problem. But I don’t get with any depth why it’s true. So I’m super happy that the original question posed by my student has been reduced to something “smaller.” I also think I might be at the point of wanting to google this to see what I can discover. I am still going to hold off for a bit longer, but I’m not sure how much longer.
Today in class, a student asked a question that stumped me. I haven’t yet given myself a lot of time to think about it, but I went into the city after school for something and on the subway ride home I had my audiobook on and I basically didn’t “hear” anything because my mind kept wandering back to this problem. (Ack! Now I have to rewind like 30 minutes of it.) And so I wanted to share it with you in case you wanted to work on it. Feel free to throw your thoughts in the comments.
We’re studying combinatorics (the art of counting) in precalculus. And we were seeing things like
pop up as answers to counting questions. And each of these evaluates to an integer.
The student asked: “BUT WHY? Why do these happen to evaluate to an integer?”
To give credit to what we’ve been doing in class, we spent about 3-4 days building up a deep conceptual understanding of why these would be the answers to particular counting scenarios, starting with first principles [1]. And we knew, since they were answers to counting problems, and that the number of outcomes to our given scenarios had to be an integer, that these had to evaluate to an integer. I would argue we have formally proved using a conceptual argument they had to turn out to be an integer. I think this is quite elegant! So on a mathematical level, we’re done. We’ve proved it.
However I liked this question a lot because I remember having it myself when I was in high school. And when I was teaching combinatorics for the first time. And randomly every so often since. I absolutely am certain I have thought about this before, and I also am certain I have no memory if I ever answered the question for myself or not. (My mind is like a goldfish.
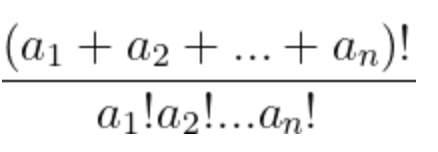
So I pose it to y’all. On apurely algebraic level, how can we prove the following will be an integer:
Or I’d be okay with an even simpler version: how could we prove (again, purely algebraically, or with number theory, but with no reference to combinatorics) that the following will be an integer:
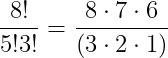
It’s harder than it looks, at least for me upon initial glance. I mean, I’m me, and needed to ground myself, so I started with a concrete example:
And I did the “canceling” and I saw we have some stuff that happens to divide evenly…
Yay, we see the 6 in the numerator divides out with the 3 and 2 (or the 6 divides out the 3… and 8 divides out the 2). But it feels like happenstance. And the more I wrote up examples, and I saw random things divide out from the denominator into various numbers in the numerator without rhyme or reason, the more happenstansical it all felt. It didn’t leave me to the next step in a proof…
The more examples I did in this very concrete and simplistic way, the more magical it felt. That I could find the right numbers in the numerator to cancel out with the numbers in the denominator — and still be left with an integer at the end! I loved the feeling of magic in math, because it means there’s something that is happening that I don’t understand, that’s ripe to be mined! And the moment I make something magical into something “obvious,” that’s when I know I’ve fully understood something. Right now, I’m in the magical phase.
In any case, I was thinking maybe I need to move forward with a proof by contradiction… or even induction?
I’m not sure if any of this made sense. But if it did, I’d love any thoughts in the comments!
[1] I have a very unique way of introducing combinatorics. At some point I should blog about it! But it basically reduces many, many combinatorial problems to the same type of problem. By the end of our unit, students don’t see “combinations” and “permutations” as different things that are related to each other. We zoom out and end up seeing them as the same thing. And moreso, my approach even lets them solve more complicated problems that combinations and permutations can become a bit more challenging to use. :)
On Thursday, after school, I hopped in an Uber to the airport. I was flying to a conference, the “Teaching Contemporary Mathematics” conference (TCM) held at the North Carolina School of Science and Mathematics. I think I’ve been at least twice over my career, maybe three times, and always found it to be a really solid conference. The big sell for me is that it’s primarily high school math-focused, and most of the sessions are given by actual math teachers about their own teaching practice. And more importantly, it’s felt like forever since I just got to geek out with other math teachers. A fellow teacher from my school and I arrived pretty late and just passed out, with dreams of conference day on Friday.
Although I haven’t blogged in forever, I wanted to at least outline a few things tonight that I can return to. But it’s late and I’m tired, so I’m only going to do a few tidbits.
There were two sessions that got the mathematical side of my brain whirring.
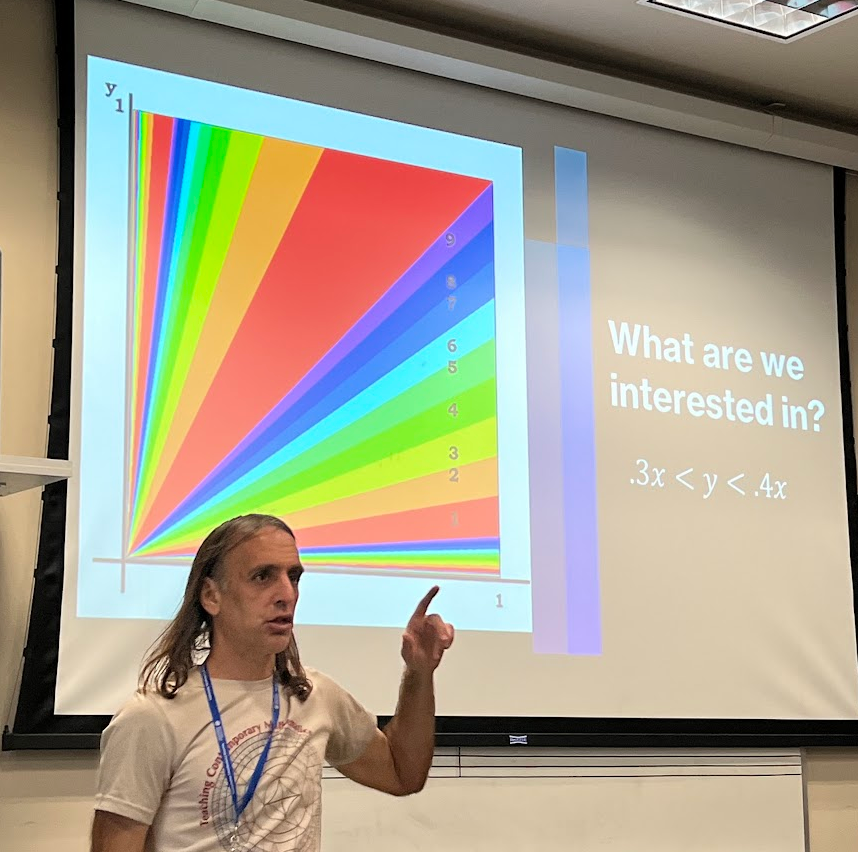
Ryan P gave a talk on “A Rainbow of Random Digits,” where he went from 1D to 2D to 3D to think about a interesting problem. I thought what he showed was beautiful, especially for the 1D and 2D which I could see using with students in a sort of ongoing independent study/investigation. For the 1D question, he asked us if we had two dowels, of length 1 and length 2, and we split the larger dowel into two pieces, what is the probability that the (now three) dowels could form a triangle. A nice fun introductory question with various approaches to answering it. For the 2D question, he asked as a warm up: if you had two numbers chosen randomly between 0 and 1, (a) what is the probability that the sum is greater than the product, and (b) what is the probability that the sum of between 5 and 6? Lovely scaffolding, and the first question requires a little bit of calculus, which is fun. And then the full 2D question (which can be answered using some calculus, but I think it’s even more beautiful without it): if you have two random numbers between 0 and 1, what is the probability that the first non-zero digit of their ratio is a 1? a 2? 3?… 9? Totally fascinating 2D probability space, with lots of “triangle slivers.” To whet your appetite, here it is:
And totally not my intution, but the probability of getting a 1 (33.3%) is greater than the probability of getting a 2 (14.9%) which is greater than the probability of getting a 3 (10.2%), etc. The calculation involves some fun infinite geometric series. All of this was new to me. I also have no idea why getting a 1 digit is more likely than getting a 2 digit which is more likely than getting a 3 digit, etc. My intuition–which was way off–made me think all digits would be equally likely. Now honestly, I don’t know how teachers can actually build something like this problem into their normal classroom practice, but I do know that I’d love to work with a student to get them from the statement of the question to the answer in a lovely set of independent investigations, and some well-thought-out hints to guide. (And maybe chatgpt to write some simple code to do an initial simulation.) My friend and colleague suggested that maybe the distribution might be related to Benford’s law.
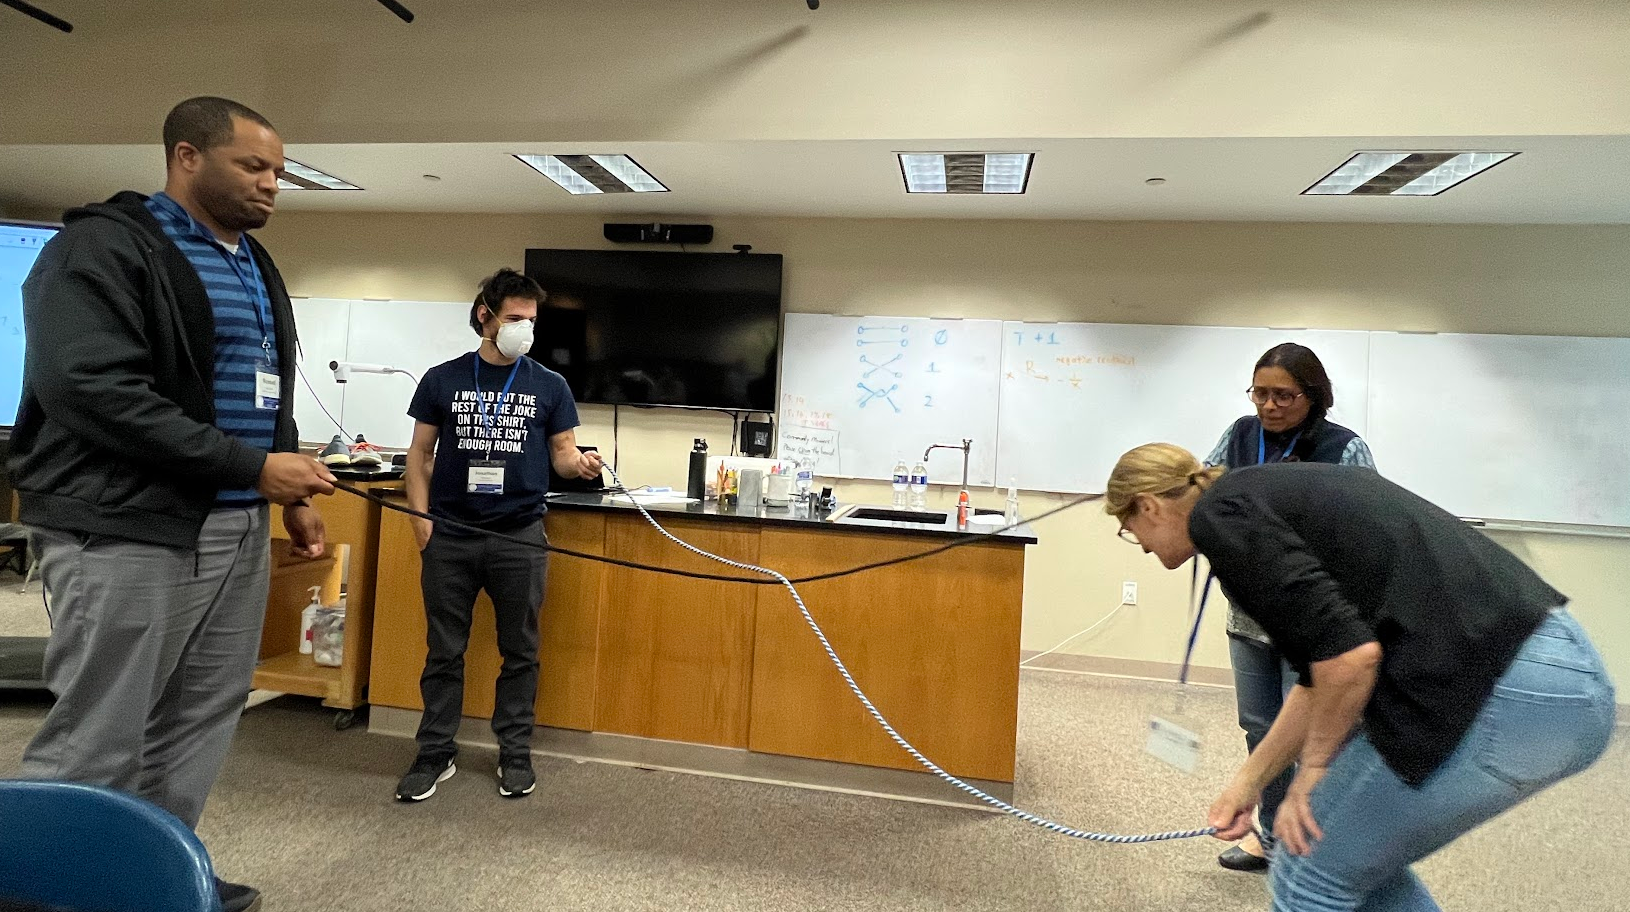
The second session that got the mathematical side of my brain whirring was by Bryan S. He had first learned about Conway’s “Rational Tangles” a few years ago, and wanted to present it to us. Wonderfully, I had first learned about these from Conway himself when I was in high school attending Mathcamp (and Conway was a guest lecturer). Conway was an electric speaker — and this one lecture of his imprinted itself on my mind. Now skip forward to this year. I had students work on “Explore Math!” projects and one worked on knot theory. I mentioned in my feedback to one student I had a really cool knot theory-adjacent thing I learned and I could show her. She responded saying “yes, please!” Of course it’s been years since I learned Rational Tangles. And it’s like the universe said “Oh, let me bring Bryan S. to you to remind you about all the nitty gritty of it.” And he was fabulous — a marvelous instructor who somehow managed to convey the excitement, weirdness, inquiry, all in a single short session. The crux of the setup is that you have two ropes held by four people:
There are two moves: T(wist) which has the front right person and back right person switch positions, where the front right person brings their rope under the back right person’s rope, and R(otate) where the four people just rotate clockwise. It turns out that by doing seqences of moves like this, such as TTRTRTTRT (etc.), you can get a pretty tangled tangle in the middle of the two ropes. One question — the main one we talked about — is if you can do a series of Ts and Rs to “undo” the tangle and get back into the original position of just two untangled ropes. Amazingly, a few Mathcampers created a digital version of this twisting and rotating and it took me about 20 minutes today to find it even though I knew it existed and I had played with it before. Here it is!
Another session I went to was Chris B’s Estimathon! I participated in my first estimathon at the Park City Math Institute many years ago (and again, a couple years ago). I hated it both times, for a few years. First, I hate estimating. I love thinking and calculating — but Fermi problems? I get really annoyed because I feel I rarely have the adjacent information that can unlock the problem. Second, the other people (both on my team and on all the other teams) were very, very competitive. I prefer a cooperative board game over a competitive board game, and in this, I think I feel similarly. That being said, I really enjoyed doing the estimathon with Chris and our other math conference participants. It was fun because the other people on my team were chill about it, and also let me sort of work alone at times when I got obsessed with a problem. Here are two example questions we were tackling:
Yes, I went to #5 because you can calculate that. Here’s what the scoring sheet looked like:
So you get to guess a minimum value and a maximum value for the range that the answer is in. And your score is ceiling(maximum/minimum). In other words, take the maximum value, divide it by the minimum value, and round up. So min: 2000, max: 3000 would yield a score of 2, and min: 2000 max: 4000 would also yield a score of 2…. but min: 2000, max: 4001 would yield a score of 3. Your goal is to get the lowest score. At the end, Chris gave us the absolute best idea (which I think he got from his colleague Emily). You have kids find out numbers for something that they are passionate about or would be an expert in. It could be “the number of pokemon” or “how many grandchildren does Sameer’s father have?” And then later in the year, you could create an estimathon out of these numbers — where kids have to see what they know about each other and their passions. I love this as a way for people to get to know each other.
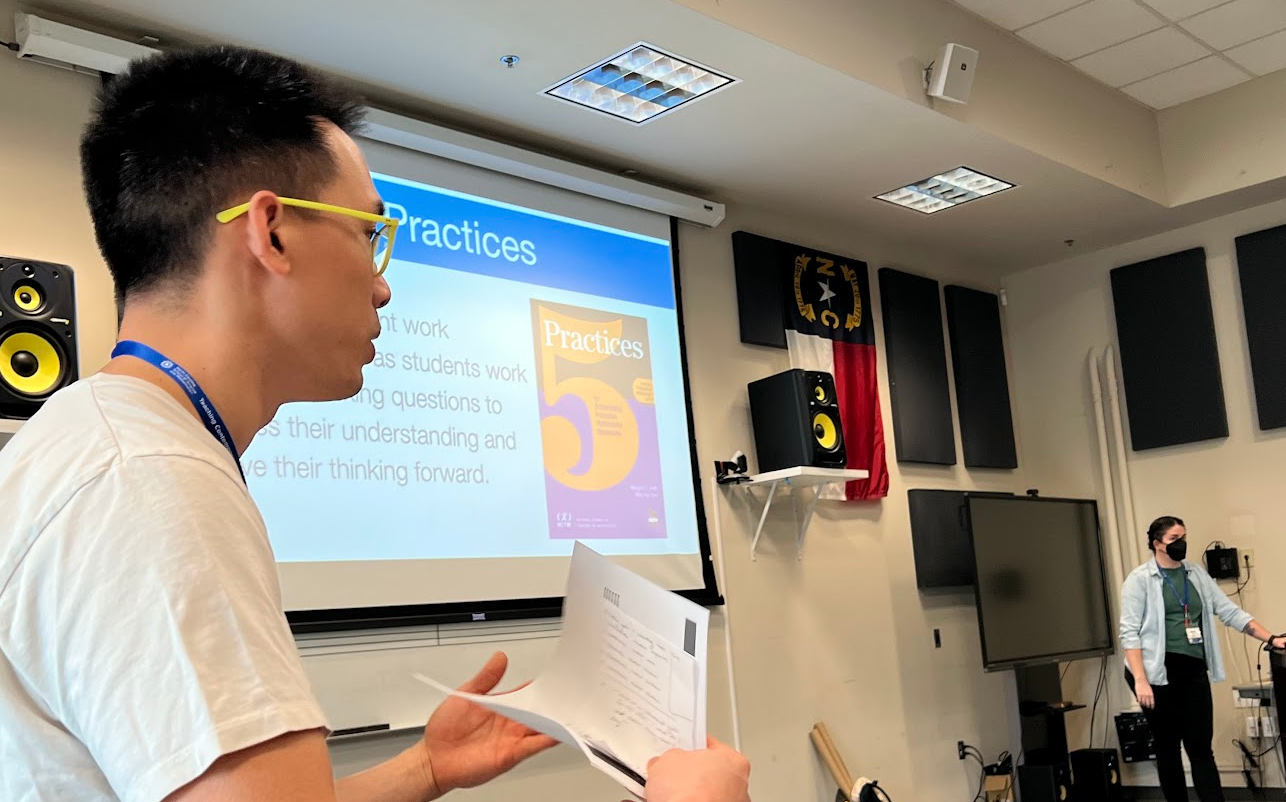
There were two additional sessions that I attended, which were about students and math, and I loved both. First was by Jenny W, Lauren B, and Kevin J, and reminded me of the “5 practices” (https://www.nctm.org/Store/Products/5-Practices-for-Orchestrating-Productive-Mathematics-Discussions,-2nd-edition-(Download)/). It’s about using Desmos to highlight and discuss student thinking and to uplift student brilliance. Although I’ve seen many, many presentions on the 5 practices over the year (especially at PCMI), this was a great reminder of a lot of the things I don’t know, and teacher moves I’ve stopped flexing.
The second was by Lauren B called “I am, We are, You are.” It highlighted a few things to me. First, there’s a gap between the demographics of people who teach mathematics (and their identities) and the population of students who learn math (and their identities). She posed a question (of which she thinks the answer is yes): “Is there a way to expand identity in a math class?” I think this is a great question to chew on — and not easy. Especially if you take away classes like statistics or data science from the mix. We played with a super engaging Desmos activity which gave us choice on which data sets to plot against each other, and the fun part was guessing what the scatter plot would look like before we saw it. And she had a quote from Rochelle Gutierrez (who I’ve met before briefly!) which I couldn’t copy down quickly enough, but went something like “Do I have to be a better you in this classroom, or can I be a better me?” This is a student asking the question — essentially saying “Do I have to mold myself to be a miniature version of you, the teacher, to succeed in this room we’re in together?” I also thought that had a lot to chew on… in terms of what we expect from students and the culture that we build together.
Okay, it’s now 9pm and I’ve been at this for way longer than I intended, so to sleep I go.
***
It’s the next day and the conference has finished and I wanted to archive — briefly — the remaining sessions.
First, Hollylynne L. gave the keynote talk “Data Science is Everywhere and For Everyone.” Some takeaways for me are that there are a few large organizations (like NCTM, NCSM, ASA, etc.) that are collaborating to create a united data science position. It’s drafted, and about to be adopted, and has four guiding principles: (1) data science is contextual and multidisciplinary, (2) data science is an investigative process, (3) data science understanding and experiences are for everyone, and (4) data science educators must develop and practice ethical uses of data. The presenter shared her experience ethnographically observing data scientists for 9 months and what traits they exhibited. Then she shared with us that she feels like data science needs to be presented to kids with larger data sets — in terms both of cases but also in number of attributes shared (e.g. not just a survey with one or two questions, but a survey that has a ton of questions!). As an expert on CODAP, she shared how to fluently use it to show data, ask questions, and then interrogate the data. That part was inspiring, and in only a few minutes showcased the power of CODAP (codap.concord.org). Her talk also got me thinking about how our department has over the years shoved all of data science/statistics to our AT Statistics courses as we were making room for everything else we need to teach. Lastly, at the end, she shared a resource I want to follow up on called InSTEP. It is a free online site [https://instepwithdata.org/public/] that is designed to get teachers ready to teach data science and statistics, and it sounds like you learn lots of content, pedagogical moves, and you learn to use various tech tools but primarily CODAP (which is what I want to learn). So yay!
My next session was by Reed H and was an invigorating conversation on Standards Based Grading. He presented a “post mortem” of him implementing SBG in his precalculus classroom for the first time, sharing why he made the switch but also the tradeoffs that occurred. Although our school is moving in a different direction, I was still curious to see how the SBG conversations were going — and it reminded me how much I liked SBG even though it took me 4 years until I had refined it to the point where I could run it fluidly in my standard calculus classes. Reed’s own observations, and the conversations we had as small and large groups, also reminded me of my own path to SBG, and how I now know there is no single flavor of SBG that is going to work for all, because its success is dependent on so many cultural and institutional factors. And there is no magic bullet that is going to make it suddenly easy.
My last session was by Verónica Z and Doru H and was on Linear Programming and Other Means of Optimization. The presenters shared three ways to do optimization without calculus. First, the standard linear programming. The second was something called the “simplex algorithm.” Honestly, I got very confused at this point, because it isn’t in any way intuitive and I think that part of the presentation was meant for people who knew the method. So I ended up stopping my notes and writing “very confused” on my page. (I did find this example that went through the algorithm that I’m curious to read though, to get the crux of the algorithm, but don’t think it will explain “why” it works.) Finally, we learned the TOPSIS algorithm which was just invented in 1991 (“Technique for Order of Preference by Similarity to Ideal Solution”). New math! And the presenter, Verónica, did a really cool job of showing us how to make a decision of which new phone to buy (out of a choice of three) if we were looking at two variables: picture quality and battery life. It’s such a simple algorithm that — at the highest level — has you develop two new “fake” phones that exist — the best phone and the worst phone — one with the best of the traits of the three phones that exist and one with the worst of the traits of the three phones that exist. We plot all three phones and the best “fake” phone and worst “fake” phone. And then we find the “distance” from each of the three phones to the best and worst “fake” phones, and use those distances to rank the phones. Details are in my notes, but I loved learning new math in the universe, and new math to me!
Lastly, the conference was raffling off math art, and although I didn’t win, a new friend did, and she saw how much I coveted them and offered me hers. I demurred and then eventually accepted.
***
Personal Note: Speakers for the most part shared their slides with attendees. So I’ve downloaded the sessions I went to and saved them on my google drive. But I don’t know if they are officially public, so I’m just linking to them here for my own easy access.
I had a thought that just occurred to me and I wanted to archive it before I forgot it. I’ll probably forget that it is even here at all, and nothing will come of it, but I had a thought about developing a new one-semester course for juniors and seniors at my school.
It would be called something like “Reading and Writing about Mathematics.”
I’ve always been obsessed with reading books that aren’t textbooks about mathematics. I have almost half a bookshelf filled with these books. I love (when I have time) reading articles about modern mathematics in Quanta magazine. I’ve sometimes formally incorporated reading books about math in my classes in the distant past (a variety of books and articles in multivariable calculus; a book called Weaponized Lies: How to Think Critically in the Post Truth Era in my Algebra 2 class). And for many years, I’ve reached out to kids and set up many math book clubs, where we meet over lunch for a few different times to read books about math. I even was once interviewed about this, and wrote an article about this.
So why not formalize this into a class?
The biggest benefit I can see for the class would be introducing students to what modern mathematics is, so they don’t leave thinking mathematicians are just doing precalculus or calculating integrals in their ivory towers. Just like kids in physics will learn that the physical world is weird and wild when they are introduced to the ideas of quantum mechanics and relativity (even though they aren’t delving into the nitty gritty) in high school, I’d like a way for kids taking this class to learn that the mathematical world is weird and wild… and most importantly: human. A course like this will humanize math for students.
Right now I’m reading Jordan Ellenberg’s book Shape: The Hidden Geometry of Information, Biology, Strategy, Democracy, and Everything Else [here], with 5 students and 2 other teachers. As we’re reading it, there are parts that intrigue students but we need to parse it out together for it to fully make sense. One example was in this book, Ellenberg talked about the question “How many holes does a straw have?” and he brings us into topology and understanding how holes can have various dimensions. As we parsed this, I thought: oh, reading this and then also doing some mini-problem sets on the math could help kids understand things at a deeper level, or confirm their understanding of what they read. We could do our own simulations of random walks, in the section involving that idea. We could parse out the idea of the “necklace problem” which we’re going to talk about at our next meeting, which I’m sure the kids won’t understand because they aren’t drawing things out but more passively reading. In other words, we’d be able upgrade a passive reading of the book to an active reading of the book with a mini-problem set that brings ideas that might not fully make sense to life.
Additionally, there are books or articles that we could read that would help students understand the social construction of mathematics (hello anything on the controversy of the ABC conjecture and Mochizuki’s “proof”).
We could learn about the origin of ideas that seem to have existed forever or that we take for granted, but actually had to be developed (e.g. the idea of “0” or the controversy over calculus being on firm footing). And mind-blowing ideas like how all of mathematics almost fell down with the work of one mathematician, Godel. And we can learn about marginalized and overlooked people. There are some really great children’s books on mathematics, so we could read some of those as we begin the class! Maybe complement that with some excerpts from Douglas Hofstader’s Godel, Escher, Bach, a newspaper article about a modern mathematical breakthrough, some math poetry, a formal mathematical paper that has come out in the past 10 years and is hailed as one of the most important discoveries, and one more piece that’s maybe more traditional, so kids can see the wide variety of ways people write about mathematics.
And kids would think about how the writing that they’re reading is effective to reaching their intended audiences, or how it isn’t effective and what would make it better.
And kids could pick ideas or people to learn about, do their own research, and write their own popular mathematics writing. We can workshop it and publish a little journal at the end of class with our pieces.
I could reach out to English teachers to learn how they facilitate conversations about books so that it doesn’t go stale (we aren’t doing the same thing every time we discuss some of the reading). I’m sure there are universities that offer similar classes, so I could see what else is out there. And I know MIT has a graduate program in science writing that I could draw ideas from.
Okay, I’m done brainstorming for now. I just wanted to get all these ideas out before I forget them. I might update this post with additional ideas as my mind percolates. As I said… most likely nothing will come of this. But I could see having a really fun summer trying to put this course together.
NOTE: The deadline has passed to propose this course for next year. But it would take me a long time to develop the course outline anyway, so I could try to design it this upcoming summer and submit it for the following year.
I’m not sure this is comprehensive, but this is a list of books I’ve worked with kids/faculty in various capacities on [but it is not all the popular math books I’ve read]
*=I’ve done this for a student (or student and faculty) book club **=I’ve led/organized a book group with just teachers on this ***=I’ve had students individually read this (to discuss with me in an independent study or for a math project)
*Anna Weltman, Supermath [here] *Edwin Abbott, Flatland [here] **G. Polya, How to Solve It [here] *Amir Alexander, Infinitesimal [here] ***Charles Seife, Zero: The Biography of a Dangerous Idea [here] *G.H. Hardy, A Mathematician’s Apology[here] ***David Leavitt, The Indian Clerk [here] *Steven Strogatz, The Calculus of Friendship [here] **Steven Strogatz, Infinite Powers [here] *Edward Frenkel, Love and Math [here] *Robert Kanigel, The Man Who Knew Infinity [here] ***James Gleick, Chaos [here] ***Yoko Ogawa, The Housekeeper and the Professor [here] *Margot Lee Shetterly, Hidden Figures: The American Dream and the Untold Story of the Black Women Mathematicians Who Helped Win the Space Race [here] ***Hiroshi Yuki, Math Girls talk about Integers [here] ***Hiroshi Yuki, Math Girls [here] *Jordan Ellenberg, How Not To Be Wrong: The Power of Mathematical Thinking [here] *Jordan Ellenberg, Shape: The Hidden Geometry of Information, Biology, Strategy, Democracy, and Everything Else [here] *Daniel Levitin,Weaponized Lies: How to Think Critically in the Post-Truth Era [here] — the first third ***Ben Orlin, Math With Bad Drawings [here] *Ben Orlin, Math Games with Bad Drawings [here] ***Paul Lockhart, A Mathematician’s Lament [here] ***Cathy O’Neil, Weapons of Math Destruction: How Big Data Increases Inequality and Threatens Democracy [here] *Hannah Fry, Hello World: Being Human in the Age of Algorithms [here] ***Allison K. Henrich, Emille D. Lawrence, Matthew A. Pons, and David G. Taylor, eds, Living Proof: Stories of Resilience Along the Mathematical Journey [here]
For a month this summer, I paid $30 to get an Alamo Drafthouse Movie Pass. Alamo is a movie theater that allow serves food and drinks. What the Movie Pass allows you to do is watch a movie every day (and you only pay a $1.89 service fee). It is summer and I figured why not? I could take good advantage of this deal. I had never gone to the movies alone before, but this past month I realized I really enjoy it!
The movies I saw using the pass:
Mission: Impossible – Dead Reckoning Part One
The Lesson
Oppenheimer
Past Lives
Indiana Jones and the Dial of Destiny
Shortcomings
Joy Ride
Haunted Mansion
Barbie
Easy A
Harry Potter and the Sorcerer’s Stone
Jules
I think my favorite was just a random movie I had never heard of and went to see to pass the time — The Lesson. And I thought the best was Oppenheimer.
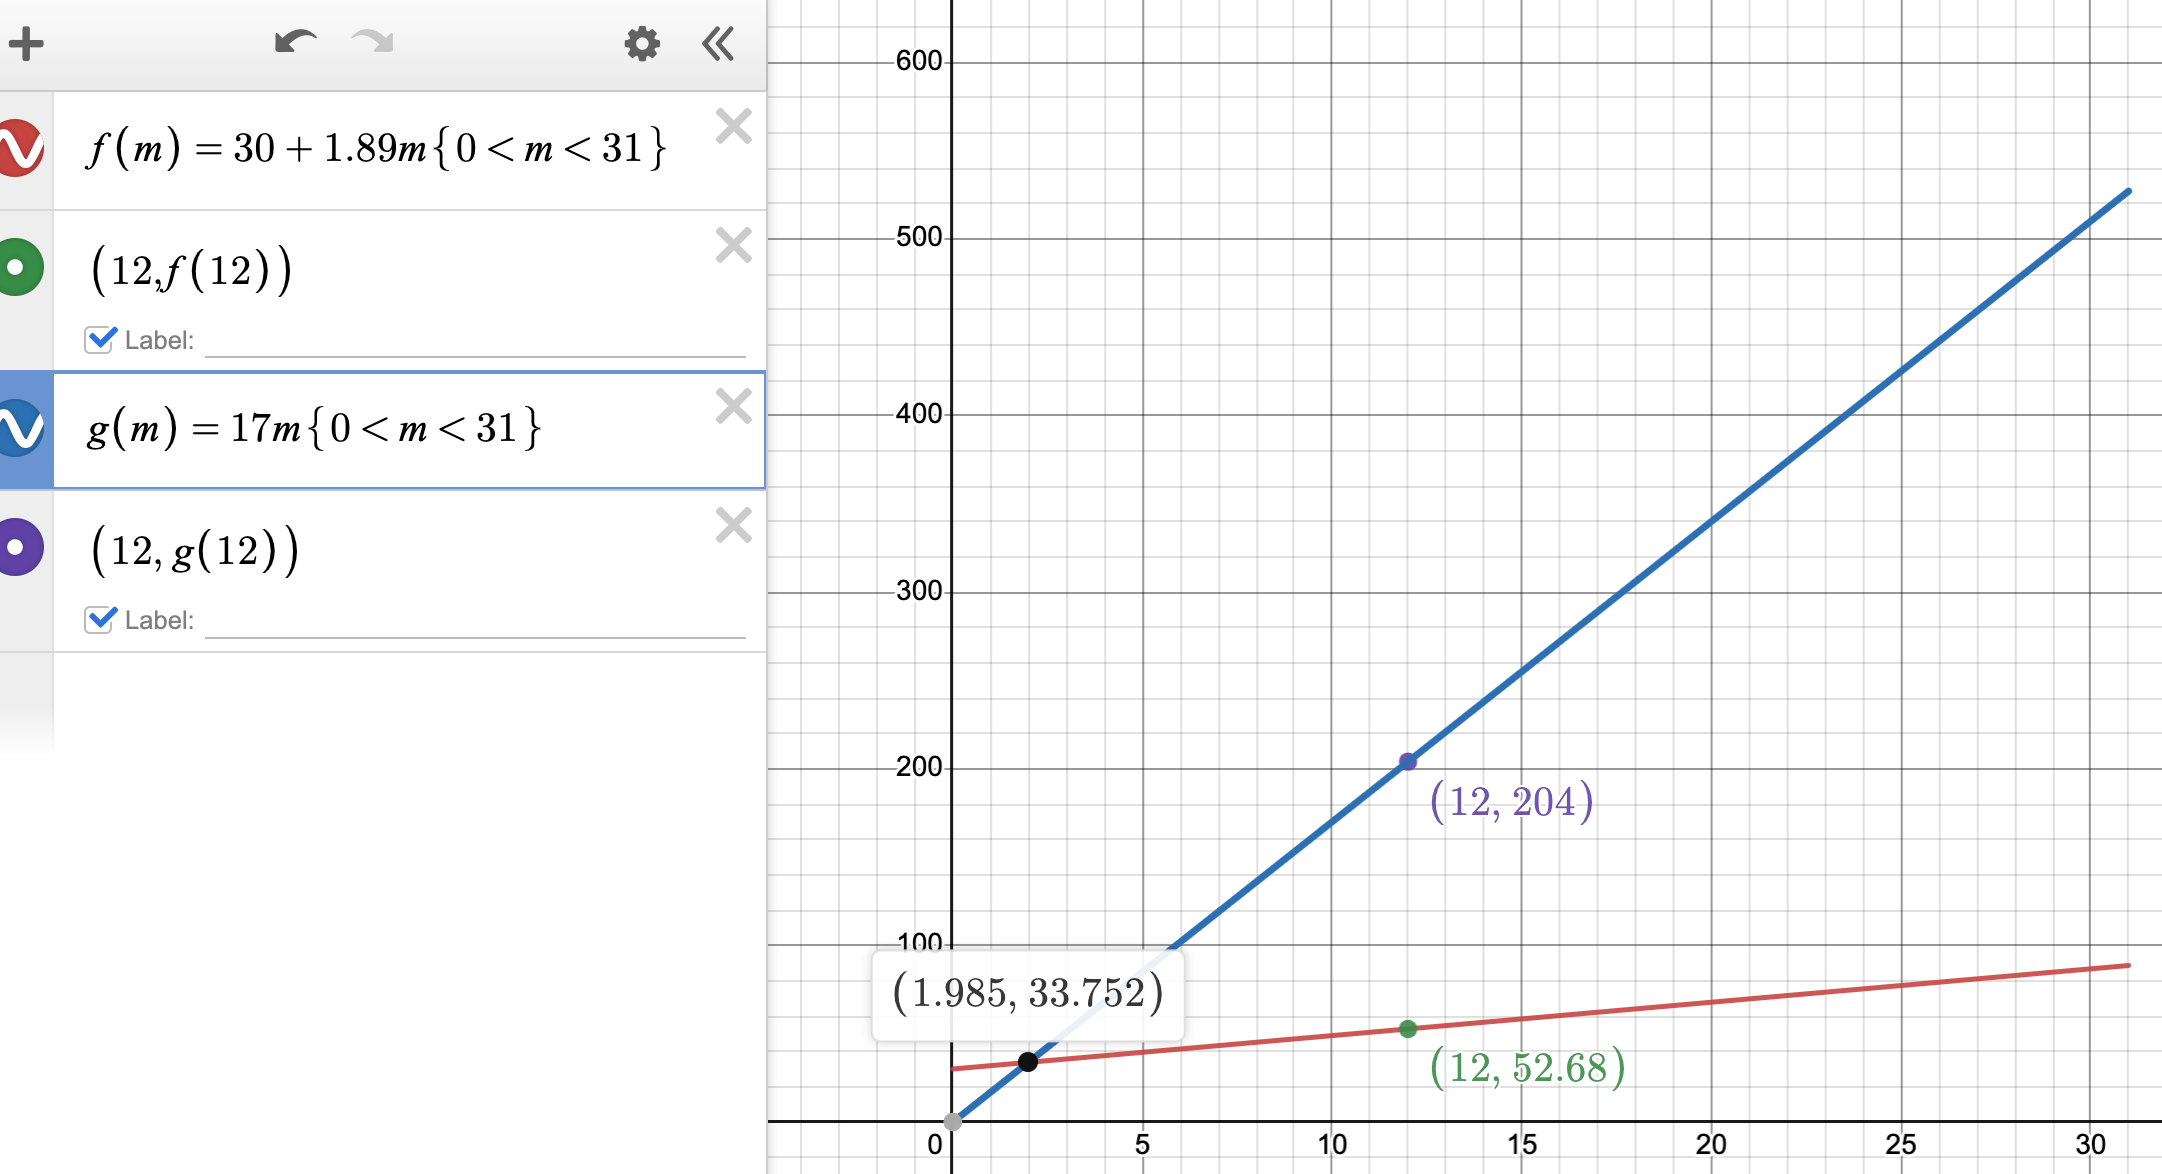
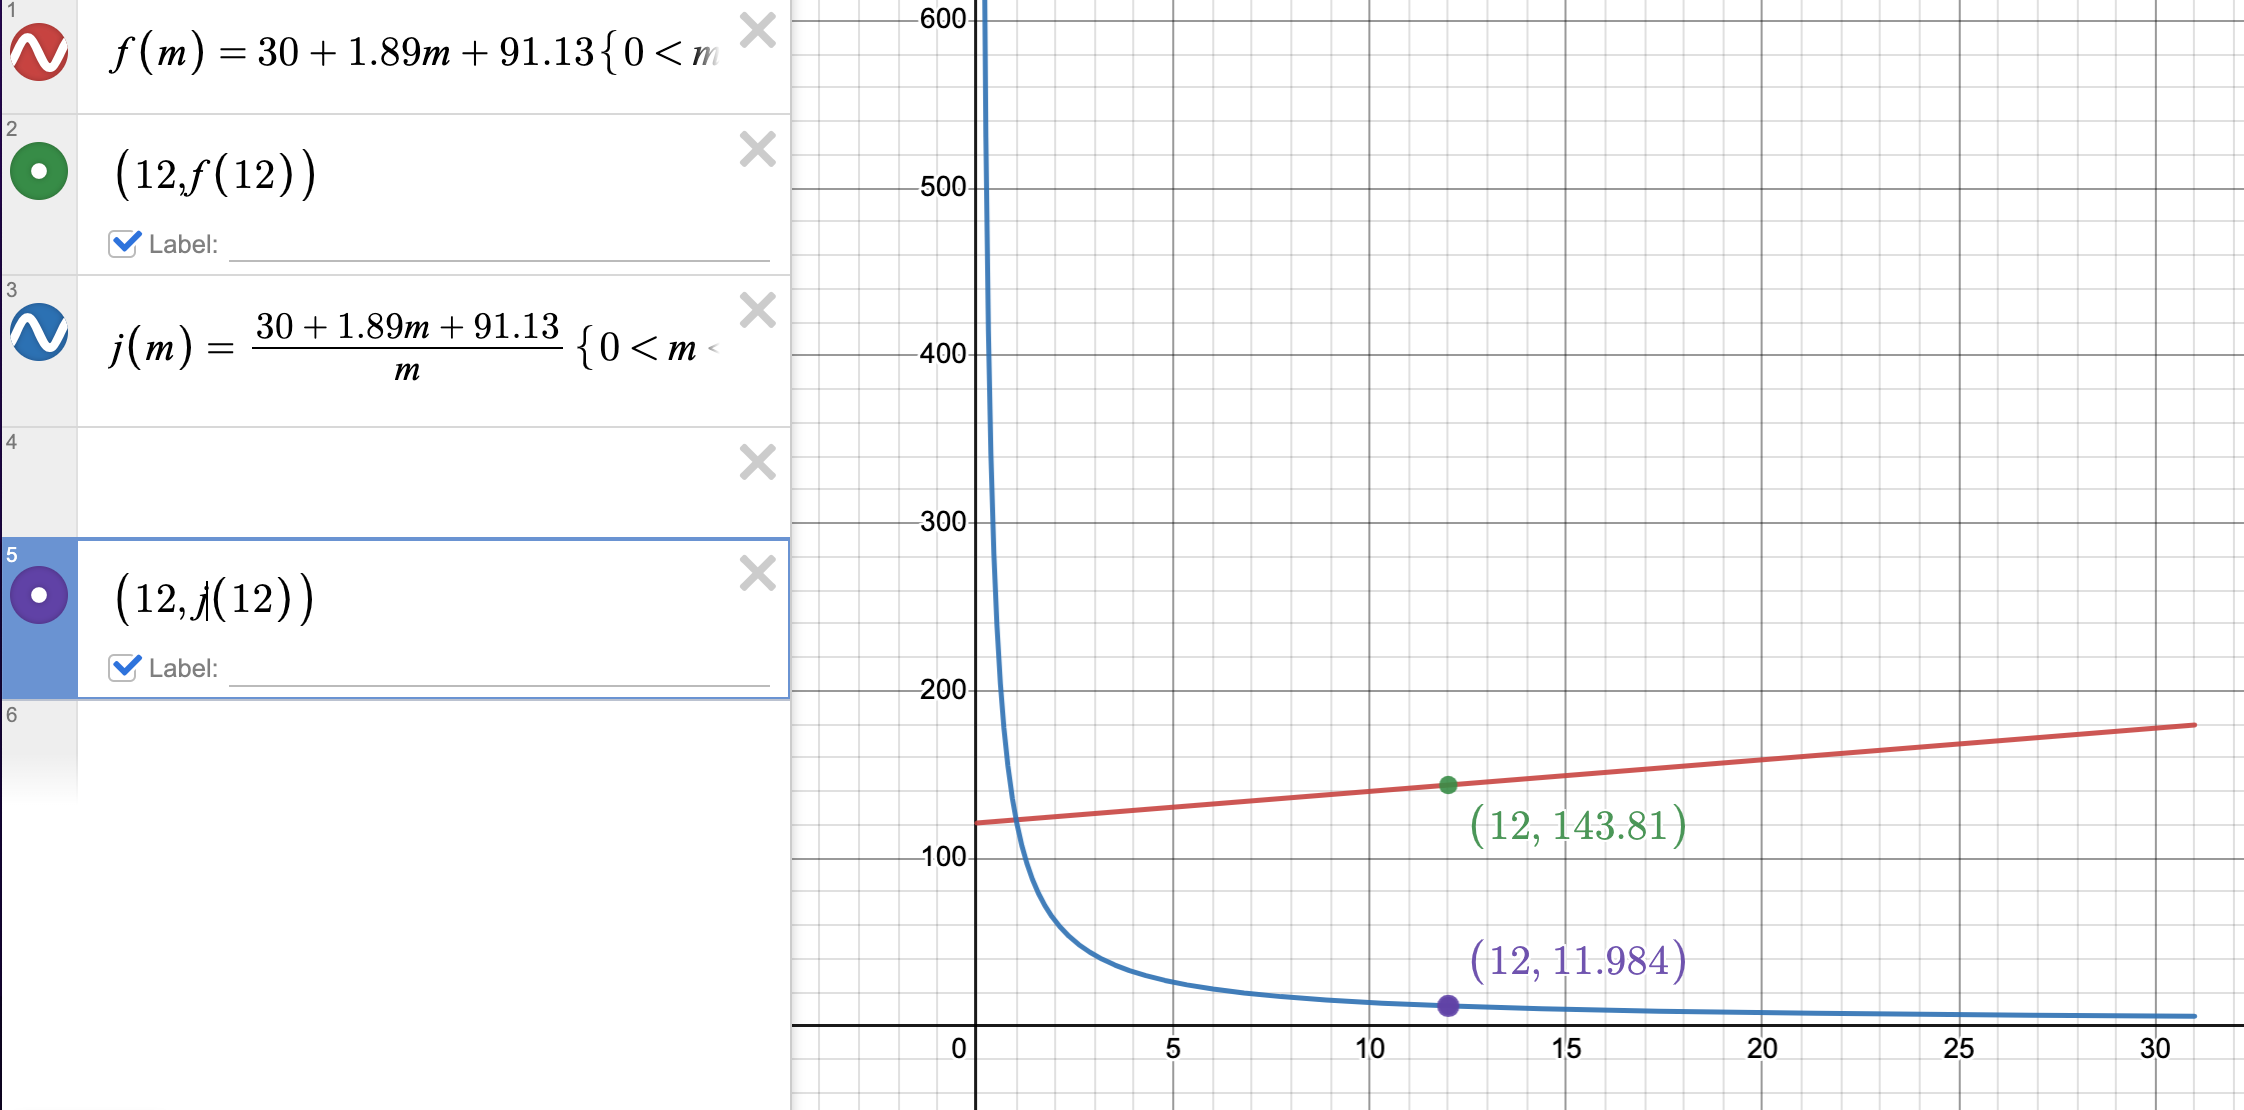
I wanted to see what a great deal this was for me. For the basic calculations, most movies cost between $15.50-$18.99 depending on the time of day (and all movies on Tuesdays are only $9). For simplicity’s sake, I’m going to say the total cost to me with the Movie Pass over the course of the month was going to be $30+$1.89m (where 0<m<31) for the price of the pass and the cost of the service fee per movie.
And without the movie pass, it would have been around $17m (since I saw some movies during the day, and some movies at night).
So the break-even point was seeing less than two movies! I spent a total of $52.68 with the pass to see 12 movies, while I would have spent out of pocket $204 if I didn’t have the pass and saw all 12 movies. I know money doesn’t really work like this, but in my mind I like to pretend I saved $151.32!
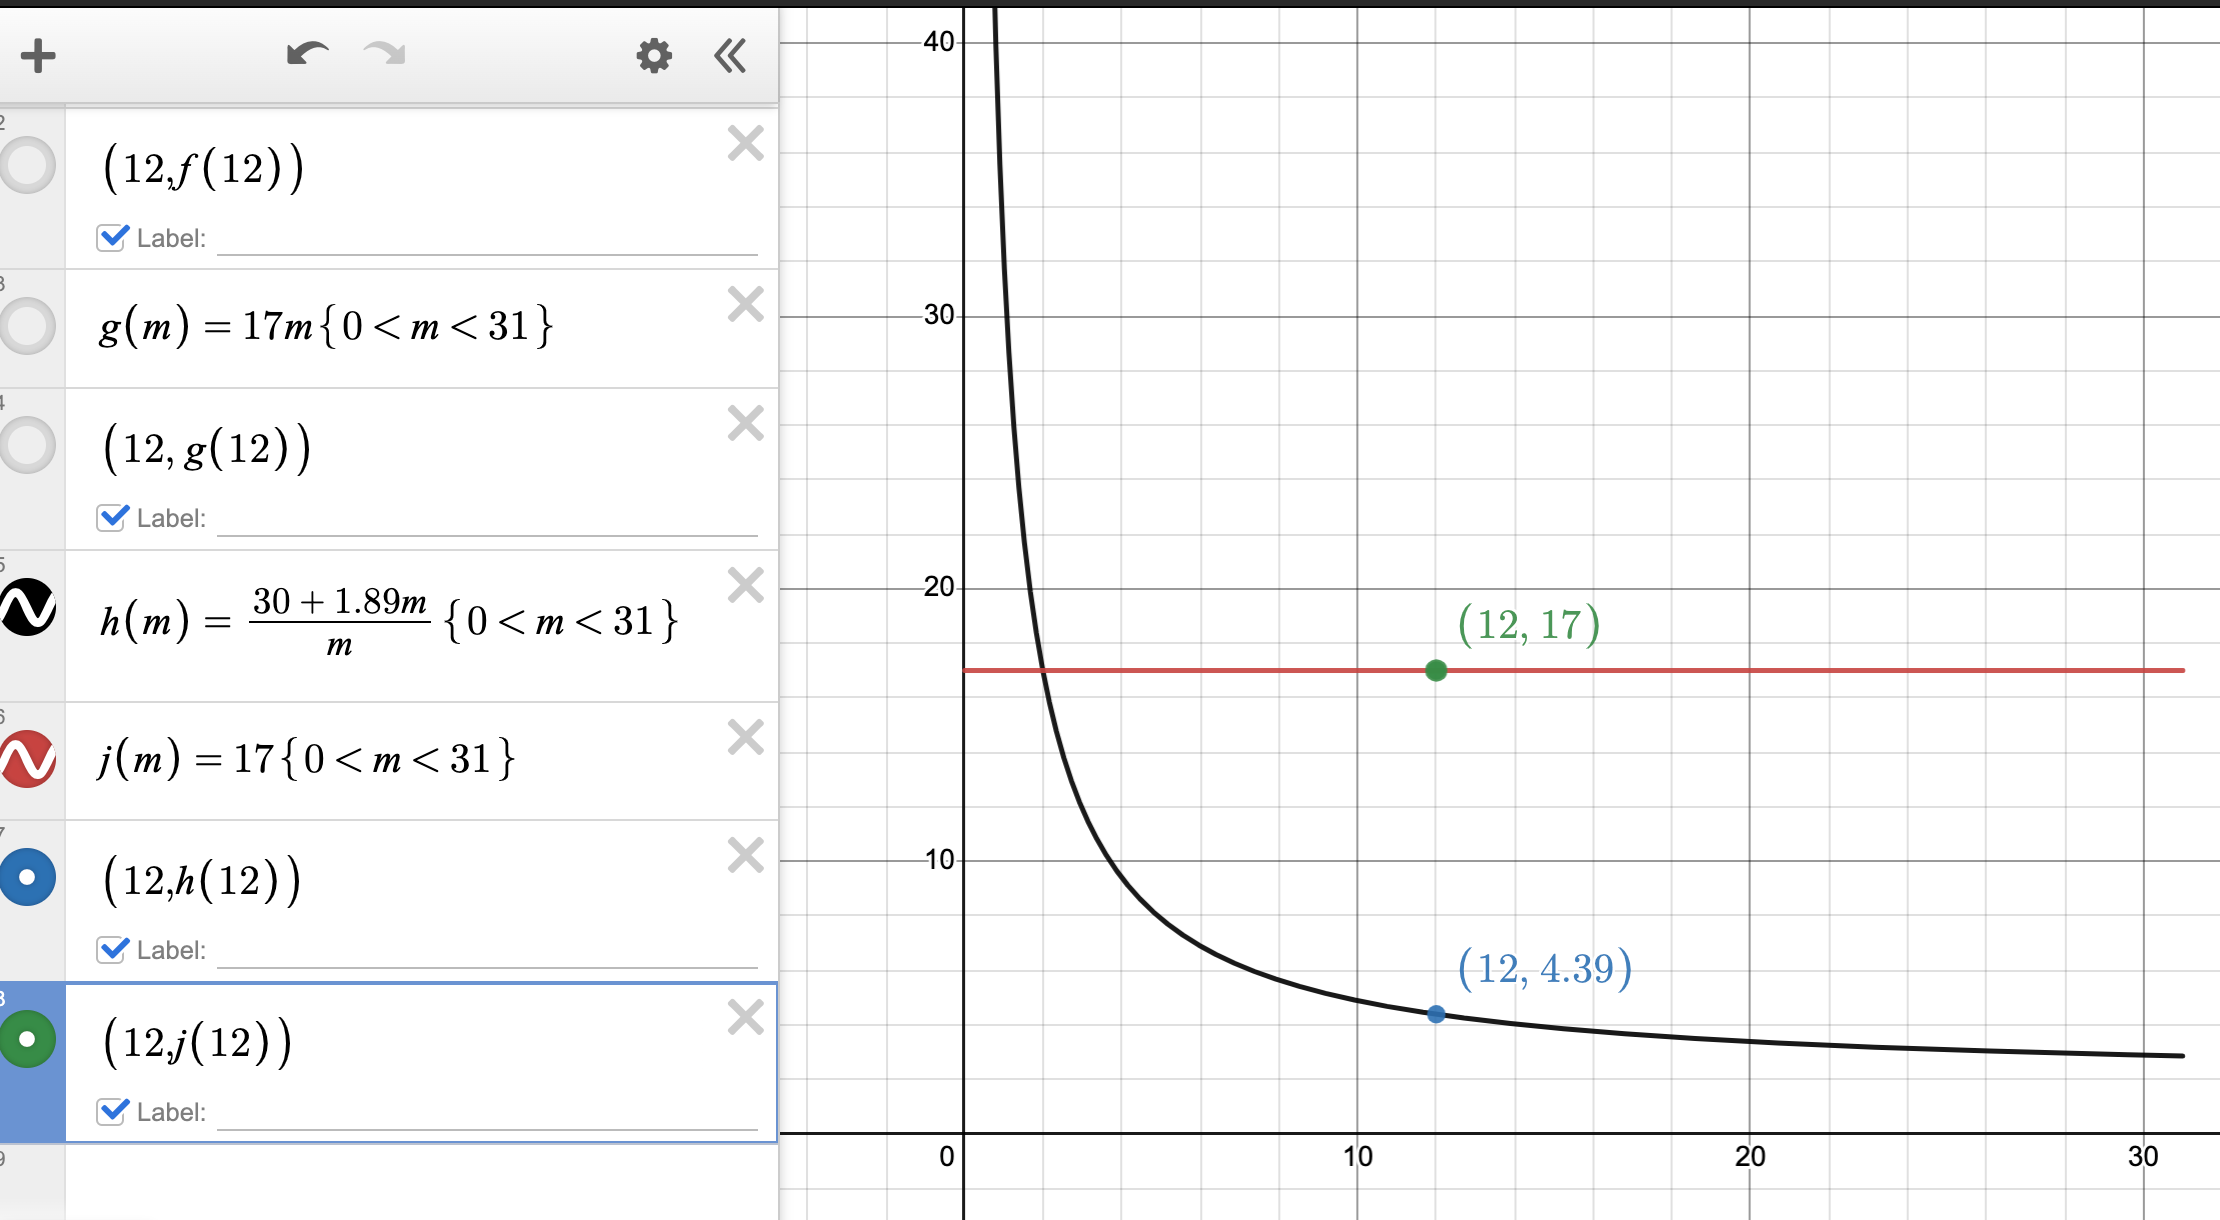
Another way to think about this is to calculate the price per ticket:
So at 12 movies, it was like each movie only cost me $4.39. (I was saving $12.61 per ticket!) And the more movies I would have watched, the cheaper each ticket would have been!
But of course, this isn’t totally realistic. The thing about the Alamo is that you have at your disposal when you go there delicious foods and drinks. When I got the pass, I vowed I wasn’t going to always get something to eat or drink — and it would be a rare occurrence. But… life happens and I ended up getting something to eat on 5 of the 12 times I went. And I calculated the total and it came to $91.13 in food/tips.
So in reality, I spent a total of $143.81 at the movies, and it was in total $11.98 per movie on average.
Psychologically, it’s a little bit sneaky. You think “oh, I can see so many movies for $30.” Then there’s that $1.89 fee per movie that isn’t a lot but adds up. And of course the impulse food purchases is something Alamo surely is counting on. So I can go around telling people (and myself) “I saw 12 movies for $30″… when the reality is that what I should be saying is “I saw 12 movies and spent $143.81.”
Throughout the month of July 2023, I participated in a PD experience that was unique to me. Justin Lanier, a former math teacher turned professional mathematician, held a PD he developed called “21st Century Mathematics” and the ultimate goal was “To grow as mathematicians, both for our own enjoyment and for the benefit of our students.”
This book’s author went through articles published in 2000-2010 in the prestigious Annals of Mathematics and found (at least to his opinion) the most important results, and wrote a section trying to explain to ____ precisely what that result was and if possible, the general argument used to get that result. The reason I used the blank in the previous sentence is because I am a little confused who the intended audience of the book was. What was great is that I — a math teacher who majored in math two decades ago — could follow along some of the sections. And we had a number of participants who were middle school math teachers who were playing along too.
Justin picked interesting and accessible sections of the book for us to read (one per week) and built his problem sets around those sections.
Week 1: Section 3.2, Representing 1 as a Sum of Reciprocals of Selected Integers.
Week 2: Section 2.13, Transforming Convex Bodies into Balls.
Week 3: Section 10.2, On Divisibility Properties of Dyson’s Rank Partition Function.
I got really hooked on the problems. They reminded me of doing super fun “morning math” at PCMI, where we got to discover new things, think in different ways, and remember the frustrations and elations of learning new math. I did hit some walls, but also had some insights I was really proud of. Since I wanted to take my hand at practicing LaTeX after many years, I typed up my work each week.
For personal archival purposes, I’m uploading my writeups for each problem set here:
We had a choice of reading the section from the book the problem sets were based on before or after working on the problems. Mostly, I chose to work on the problems first, and then after finishing the problem set to the best of my ability, work on understanding the section from the book.
In addition to working on these independently, all the participants had a Discord that we were invited to to chat. I had never used Discord before, but it was pretty neat. We introduced ourselves there, and not all people used it to talk, but some of us were sharing insights and asking questions about the problems there.
Each week, we had a Zoom. Justin offered it twice each week because everyone has such different schedules in the summer. The first part of each Zoom was Justin talking to us about what it means to do research, and be a mathematician, in the 21st century. It was interesting to see some of the charts and data he collected about number of publications, number of PhDs, and gender and minority representation (or underrepresentation, as the case it, obviously). Then we broke up into breakout rooms and discussed the problem set questions.
Additionally, we were invited to read and summarize a different section in the book — whatever section felt accessible and interesting to us. I really enjoyed this part! The first week, I chose a section and then got into a long discussion of something I didn’t understand on the Discord with a few others. I honestly think I found an error in the book — not in the math, I’m sure, but in how the theorem was described in the book.
The three sections I chose to read and try to understand were:
Section 8.7: ”A Negative Answer to Littlewood’s Question about Zeros of Cosine Polynomials.
Section 10.2: ”On divisibility properties of Dyson’s rank partition function.”
Section 2.5: ”The Optimality of the Standard Double Bubble”
(You can read my summaries of what I understood from each section at the bottom of each problem set I turned in.)
Additionally, Justin invited mathematicians to talk to us on a Zoom each week. The truth is, this is one thing I didn’t participate in. I’m so mad at myself. I talked myself out of it, because I secretly was so nervous of being the only person in the Zoom and then having nothing to say. An irrational fear, but it won out.
Lastly, in the fourth week, Justin didn’t have problems and readings. We each were asked to create a 2-5 minute presentation on anything related to the course. Some wrote up what they learned. Others created activities for their classroom based on something they discovered mathematically or pedagogically. Some delved more into the readings. I did that.
Again, for archival purposes, here’s my presentation on “partitions” and “rank”. However just note that it’s designed for someone who read the reading.
The structure was sort of a choose-your-own adventure. You could choose to do the problems or not. You could choose to engage in the Discord or not. You could choose to the Week 4 presentation or not. I was curious how I’d feel about this being a remote PD. I’m so over Zoom that I almost didn’t sign up because of that. But it turned out that for someone like me, who wanted to do (almost) all the things, this all threaded together to make a really wonderful mathematics-filled July.
I loved doing math over the summer, and having some light structure to guide me! And learn a bit about what has been happening in mathematics more recently in a different way than reading Quanta articles.
This is a continuation of the previous post. My goal here is to connect this up to calculus.
Below is a graph of stitches I need to make to create any given row. So for example in Row 16 and Row 17, I have to make 45 stitches.
So to find the total number of stitches from row 1 to row n, I have to take the integral of this function.
So to find the total number of stitches in the entire shawl, I’ll take the integral from 0 to 168.
And two things become apparent. First, we get the answer we expected from the calculations in the previous post: 30,072 stitches. Second, we have a Riemann Sum that looks like a bunch of mini-rectangles, but since we’re doing so many rectangles, it almost looks like we’re taking the integral of a line and estimating it using a Riemann Sum!
So what line is this?
The line is y=2x+11. Why? Every 2 rows of stitching should increase by 4 stitches. So each row we move up should increase 2 stitches. And the +11 comes from the fact that the first row has 13 stitches! So 2(1)+11=13.
Let’s check a little more to ensure we’re thinking properly! The number of stitches forrow1+row2=13+13=26. And when we take the integral of 2x+11 from 0 to 2 gives us an area of 26. (We can intuit that visually from the graph or algebraically by calculating the integral.) And similarly, the number of stitches for row3+row4=17+17=34. And when we take the integral of 2x+11 from 2 to 4 gives us an area of 34.
So let’s say g(x)=2x+11 is a function that gives the number of stitches in row x.
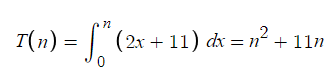
So if we want the total number of stitches from row 0 to row n, which we’ll call T(n), we have to integrate this function:
Whaaaa? Oh right! That’s precisely the equation we got in the previous post by the arithmetic sum! It’s the cumulative sum of stitches, not how many stitches per row.
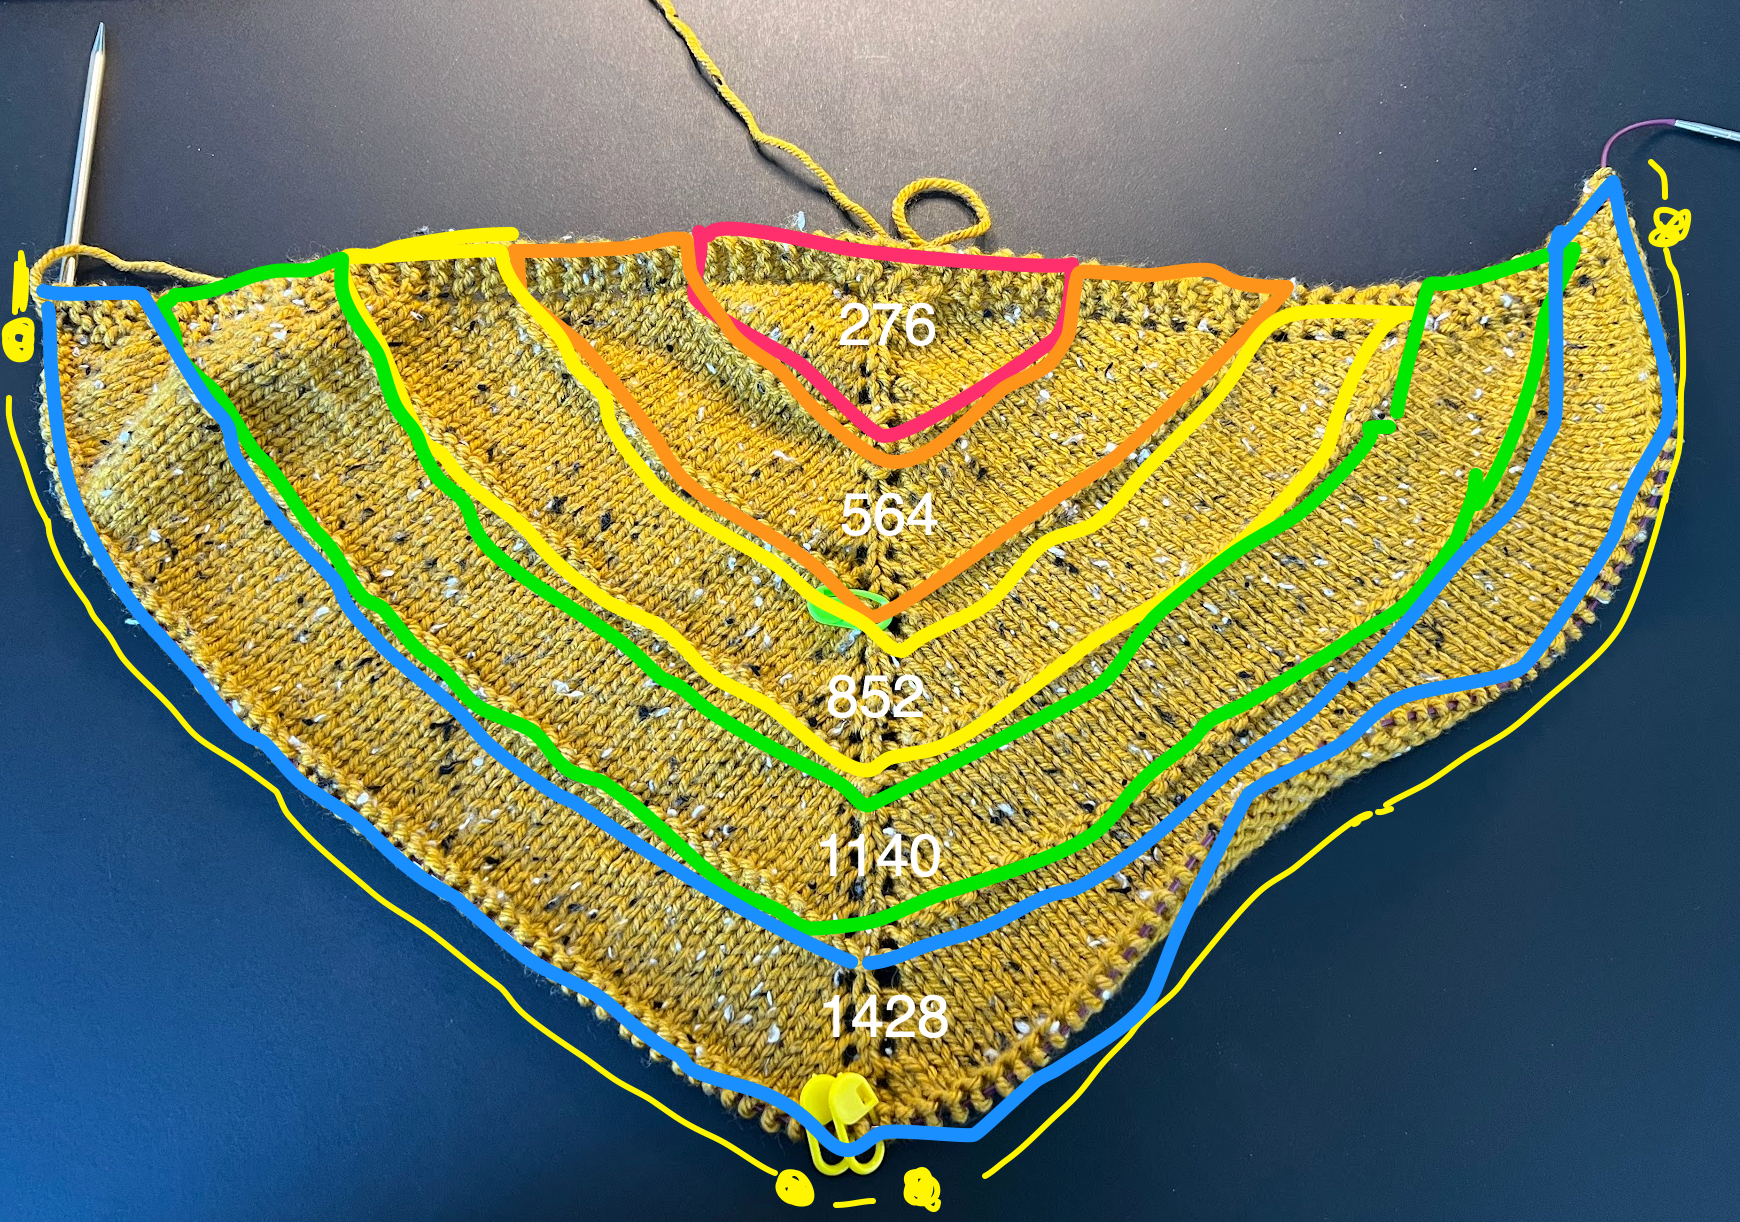
And so let’s see how many stitches are needed in the first triangular section, second triangular section, third triangular section, etc…
Oooh this matches (as we’d expect) what we saw from the previous post:
Lastly, I was curious when I’d be halfway done with the Shawl. Since there were 30,072 stitches in the shawl, I wanted to see what row would give me the halfway stitch. It is row 117.245. Since each triangular section takes 12 rows to knit, that would be when I’m knitting the 9th triangular section of the shawl!
I was also thinking we could answer this using a basic geometric idea. When we finish the first triangular section, it has area A. Then when we finish the second triangular section, it has area 4A. Why? Because the second triangle is similar to the original triangle but with all sides twice as large. Thus, the area increases as the square! When we finish the third triangular section, it has area 9A. And so forth! So after the 14th triangular section, we have an area of 196A.
So the total area of the whole shawl is 196A. So half the area would have an area of 196A/2=98A.
This would happen after we finish the 9th triangular section (an area of 81A) and the 10th triangular section (an area of 100A). Yay, our geometric understanding matches our algebraic understanding!