Algebra II

Graham’s Number

TL;DR: If you have an extra 45-60 minute class and want to expose your 9th/10th/11th/12th graders to a mindblowingly huge number and show them a bit about modern mathematics, this might be an option!

In one of my precalculus classes, a few kids wanted to learn about infinity after I mentioned that there were different kinds of infinity. So, like a fool, I promised them that I would try to build a 30 minute or so lesson about infinity into our curriculum.

As I started to try to draft it — the initial idea was to get some pretty concrete thinkers to really understand Cantor’s diagonalization argument — I decided to build up to the idea of infinity by first talking about super crazy large numbers. And that’s where my plan got totally derailed. Stupid brain. At the end of two hours, I had a lesson on a crazy large number, and nothing on infinity. You know, when that “warm up” question takes the whole class? That’s like what happened here… But obvi I was stoked to actually try it out in the classroom.

In this post, I’m going to show you what the lesson was, and how I went through it, with some advice for you in case you want to try it. I could see this working for any level of kid in high school. Now to be clear, to do this right, you probably need more than 30 minutes. In total, I took 35 minutes one day, and 20 minutes the next day. Was it worth it? Since one of my goals as a math teacher is to try to build in gaspable moments and have kids expand their understand of what math is (outside of a traditional high school curriculum): yes. Yes, yes, yes. Kids were engaged, there were a few mouths slightly agape at times. Now is it one of my favorite things I’ve created and am I going to use it every year because I can’t imagine not doing it? Nah.

We started with a prompt I stole from @calcdave ages ago when doing limits in calculus.

pic1


Kids started writing lots of 9s. Some started using multiplication. Others exponentiation. Quite a few of them, strangely, used scientific notation. But I suppose that made sense because that’s when they’d seen large numbers, like Avagadros number! I told them they could use any mathematical operations they wanted. After a few minutes, I also kinda mentioned that they know a pretty powerful math operation from the start of the school year (when we did combinatorics). So a few kids threw in some factorial symbols. Then I had kids share strategies.

Then I returned to the idea of factorials and asked kids to remind me what 5! was. Then I wrote 5!!. And we talked about what that meant (120!). And then 5!!! etc. FYI: this idea of repeating an operation is important as we move on, so I wouldn’t skip it! They’ll see it again in when they watch the video (see below). While doing this, I had kids enter 5! on their calculator. And then try to enter 120!. Their calculators give an error.

pic2

Yup, that number is super big.

Then I introduced the goal for the lesson: to understand a super huge number. Not just any super huge number, but a particular one that is crazy big — but actually was used in a real mathematical proof. And to understand what was being proved.

Lights go off, and we watch the following video on Graham’s number. Actually, wait, before starting I mention that I don’t totally follow everything in the video, and it’s okay if they don’t also… The real goal is to understand the enormity of Graham’s number!

I do not show the beginning part of the video (the first 15) because that’s the point of the lesson that happens after the video. While watching this, kids start feeling like “okay, it’s pretty big” and by the end, they’re like “WHOOOOOOAH!”

Now time for the lesson… My aim? To have kids understand what problem Ronald Graham was trying to understand when he came up with his huge number. What’s awesome is that this is a problem my precalculus kids could really grok. But I think geometry kids onwards could get the ideas! (On the way, we learned a bit about graph theory, higher dimensional cubes, and even got to remember a bit about combinations! But that combinations part is optional!)

I handed out colored pencils (each student needed two different colors… ideally blue and red, but it doesn’t really matter). And I set them loose on this question below.pic3

It’s pretty easy to get, so we share a few different answers publicly when kids have had time to try it out. The pressure point for this problem is actually reading that statement and figure out what they’re being asked to do. When working in groups, they almost always get it through talking with each other!

One caveat… While doing this, kids might be confused whether the following diagram “works” or if the blue triangle I noted counts as a real triangle or not:

pic4

It doesn’t count as a real triangle since the three vertices of the triangle aren’t three of the original four points given. During class I actually made it a point to find a kid who had this diagram and use that diagram to have a whole class conversation about what counts as a “red triangle” or “blue triangle.”. Making sure kids understand what they’re doing with this question will make the next question go more smoothy!

Now… what we are about to do is super fun. I have kids work on the extension question. They understand the task (because of the previous one). They go to work. I mention it is slightly more challenging.

pic5

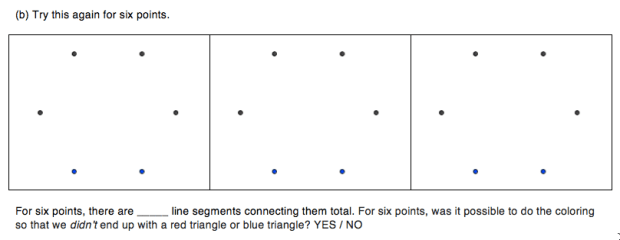
As they work, kids will raise their hand and ask, with trepidation, if they “got it.” I first look to make sure they connected all the points with lines. (If they didn’t, I explain that every pair of points needs to be connected with a colored line.) Then I look carefully for a red or blue triangle. Sometimes I get visibly super excited as I look, saying “I think you may have gotten it! I think you may… oh… sad!” and then I dash their hopes by pointing out the red or blue triangle I found. (So here’s the kicker: it’s impossible to draw all the line segments without creating a red or blue triangle… so I know in advance that kids are not going to get it… but they don’t know this.) After I find one (or sometimes two!) red or blue triangles, I say “maybe you want to start over, or maybe you want to start modifying your diagram to get rid of the red/blue triangle!” Then they continue working and I go to other students.

(It’s actually nice when students try to modify their drawings, because they see that each time they try to fix one thing, another problem pops up. They being to *see* that something is amiss!)

This takes 7-8 minutes. And you really have to let it play out. You have to ham it up. You have to pretend that there is a solution, and kids are inching towards it. You have to run from kid to kid, when they think they have a solution. It felt in both classes like a mini-contest.

Then, after I see things start to lag, I stop ’em. And then I say: “this is how you can win money from your parents. Because doing this task is impossible [cue groans… let ’em subside…] So you can bet ’em a dollar and say that they can have up to 10 minutes.!That it takes great ingenuity to be successful! What they don’t know is… you’re going to get that dollar! Now we aren’t going to prove that they will always fail, but it has been proven. When you have six or more dots, and you’re coloring all lines between them with one of two colors, you are FORCED to get a red or blue triangle.” [1]

Now we go up a dimension and change things slightly. Again, this is a tough thing to read and understand so I have kids read the new problem aloud. And then say we are going to parse individual parts of it to help us understand it.

pic6.png

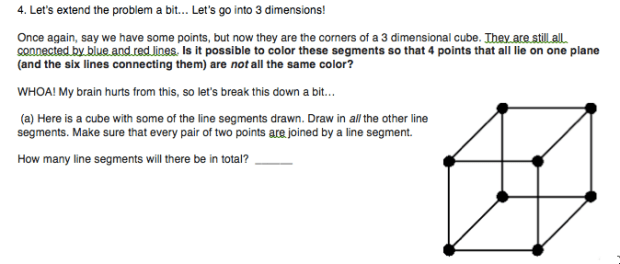
And then… class was over. I think at this point we had spent 35 minutes all together. So that night I asked kids to draw all the line segments in the cube, and then answer the following few questions:

pic7.png

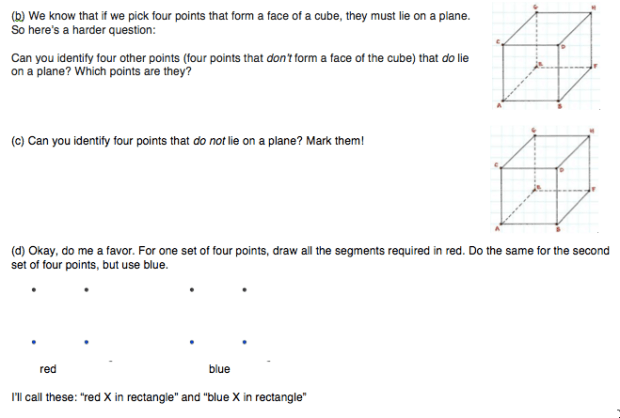
These questions help kids understand what the new problem is saying. In essence, we’re looking to see if we can color the lines connecting the eight points of a cube so that we don’t get any “red Xs” or “blue Xs” for “any four points in a plane.” Just like we were avoiding forming “red triangles” and “blue triangles” before when drawing our lines, we’re now trying to avoid forming “red Xs” and “blue Xs”:

pic8.png

So the next day, we go over these questions, and I ask how this new question we’re working on is similar to and different from the old question we were working with. (We also talk about how we can use combinatorics to decide the number of line segments we’d be paining! Like for the cube, it was _8C_2 and for the six points it was _6C_2 etc. But this was just a neat connection.) And then I said that unlike the previous day where they were asked to do the drawings, I was going to not subject them to the complicated torture of painting all these 28 lines! (I made a quick geogebra applet to show all these lines!) Instead I was going to show them some examples:

pic10.png

It’s funny, but it took kids a long while to find the “red X” in the left hand image. Almost each class had students first point out four points that didn’t form a red X, but was close. But more important was the right hand figure. No matter how hard you look, you will not find a red X or blue X. Conclusion: we can paint these line segments to avoid creating a red X or blue X. Similar to before, when we had four points, we could paint the line segments to avoid having a red triangle or blue triangle!

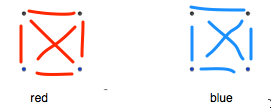
So now we’re ready to understand the problem Graham was working on. So I introduce the idea of higher dimensional cubes — created by “dragging and connection.” I don’t take forever with this, but kids generally accept it, with a bit of heeing and hawing. More than not believing that it’s possible, kids seem more enthralled about the process of creating higher dimensional cubes by dragging!

pic11.png

And then… like that… we can tie it all together with a little reading:

pic13.png

And… that’s the end! At this point, kids have been exposed to an incomprehensibly large number. And kids have learned a bit more about the context in which this number arose. Now some kid might want to know why we care about higher dimensional cubes with connecting lines painted red/blue. Legit. I did give a bit of a brush off answer, talking about how we all have cell phones, and they are all connected, so if we drew it, we’d have a complex network. And analyzing complex networks is a whole branch of math (graph theory). But that’s pretty much all I had!

In case it’s helpful: the document/handout I used: 2017-04-04 Super Large Numbers (Long Block).

[1] I like framing this in terms of tricking their parents. We’ve been doing that a bunch this year. And although I understand some teachers’ hesitation about lying to their students about math, I think if you frame things well, don’t do it all the time, it can be fine. I don’t think any student felt like I was playing a joke on them or that they couldn’t trust me as their math teacher because of it.

Advertisement

Getting familiar with the Unit Circle

In our standard precalculus class, we’ve spent 4 days “getting ready” for trigonometry. Which sounds crazy, until you see what awesome thing we’ve done. But I’ll blog about that later. Right now I want to share what I created to help kids start learning the unit circle.

Here were the hurdles:

  1. We are introducing radians for the first time this year. So they’re super unfamiliar.
  2. The unit circle feels overwhelming.
  3. Although I am familiar with the special angles in degrees and radians, kids aren’t. So I know when I hear 210 degrees that’s “special” but kids don’t know that yet.

Here is what we have done:

  1. Filled in a “blank unit circle” using knowledge of 30-60-90 degree triangles, 45-45-90 degree triangles, and reflections of 1st quadrant points to get the points in the other quadrants.

In this post, I’m going to do here is to share what I’m going to be doing to help kids learn the unit circle.

Phase I: Get confident with angles

angles

I am going to talk about these like pizza. And to start, focus on radians.

I’m going to remind kids that \pi 
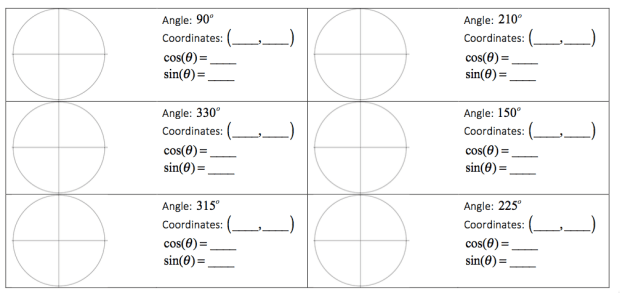
radians is a half rotation about the circle. Then we can see that each pizza pie slice is \frac{\pi}{2},\frac{\pi}{4}, \frac{\pi}{3}, and\frac{\pi}{6} radians. [The “top” half of the pizza is divided into two, four, three, or six pieces! And the top half is \pi radians!]

Then I’m going to work on the “easy-ish” angles by pointing at various places on the unit circle and have kids figure out the angle. I am going to have kids not only state the angle in radians, but also explain how they found it. For each angle, I will ask for a few different ways one could determine the angle measure. Then I’m going to repeat the same thing with the “easy-ish” angles, except I am going to do it in degrees.

And then… you guessed it… I’m going to do the same exercise but with the “harder-ish” angles. Start with radians. Then again with degrees. Always justifying/explaining their thinking.

Finally, I am going to let them practice for 5-8 minutes using this Geogebra applet I made. The goal here? To focus on getting kids familiar with the important special angles. Not only what the values are of these angles, but also to get them to start finding good ways to “see” where these angles are.

ggb1.png

Phase II: Start Visualizing Side Lengths — utilizing short/long

Next comes getting kids to quickly figure out the coordinates of these special angles.

shortlong

We’ve already been working on special right triangles, so I think this should be fine. And then…

angles2.png

Kids are asked to visualize the side lengths/coordinates based on the drawing. So, for example, for the first problem, kids will see that the angle is \frac{4}{3}\pi
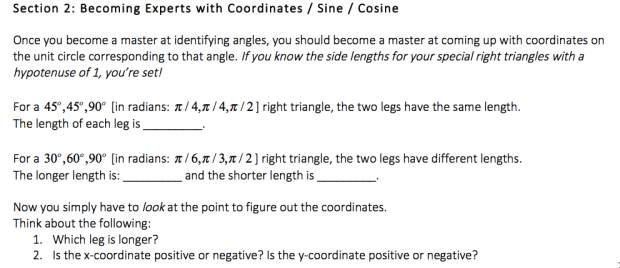
. They hopefully would have mastered that from the previous exercise. They also will see that if they would draw the reference triangle, the x-leg is shorter than the y-leg, so they know the x-coordinate must be \frac{1}{2} (but negative), and the y-coordinate must be \frac{\sqrt{3}}{2} (but negative).

After practicing with this for these four problems, kids are going to practice some more using this second geogebra applet I created.

GGB2.png


Phase III: Putting It All Together

It’s now time to take the training wheels off. No longer do I give the picture to help visualize things. Now, I give the angle. This is more like what kids are going to be seeing. They need to know \sin(315^o) and \cos(3\pi/4). No one is going to be giving them nice pictures!
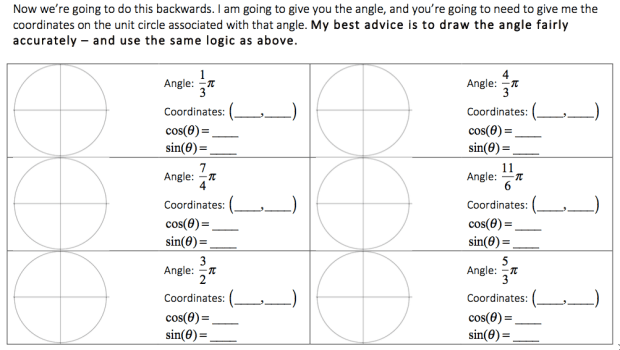
So this is what they’re tasked with:

1.png

2.png

I have a strong feeling that breaking down the unit circle in this way is going to make all the difference in the world. Fingers crossed!

If you want the file I created for my kids, here you go (.docx2017-02-xx Basic Trigonometry #2.docx:  , PDF: 2017-02-08-basic-trigonometry-2)!

Visualizing Standard Deviation

A few days I got an email from someone (Jeremy Jones) who wanted me to look at their video on standard deviation. And then today, I was working with Mattie Baker at a coffeeshop. He was thinking about exactly the same thing — how to get standard deviation to make some sort of conceptual sense to his kids. He said they get that it’s a measure of spread, but he was wondering how to get them to see how it differs from the range of a data set (which also is a measure of spread).

Of course I was hitting a wall with my own work, so I started thinking about this. While watching Jeremy Jones’s video, I started thinking of what was happening graphically/visually with standard deviation.And I had an insight I never really had before.

So I made an applet to show others this insight! I link to the applet below, but first, the idea…

Let’s say we had the numbers 6, 7, 7, 7, 11. What is the standard deviation?

First I calculate the mean and plot/graph all five numbers. Then I create “squares” from the numbers to the mean:

pic1

The area of those squares is a visual representation of how far each point is from the mean.[1] So the total areas of all those five rainbow squares is a measure of how far the entire data set is from the mean.

Let’s add the area of all those squares together to create a massive square.

pic2

As I said, this total area is a measure of how far the entire data set is from the mean. How spread out the data is from the mean.

Now we are going to equalize this. We’re going to create five equal smaller squares which have an area that matches the big square.

pic3

We’re, in essence, “equalizing” the five rainbow colored squares so they are all equal. The side length of one of these small, blue, equal squares is the standard deviation of the data set. So instead of having five small rainbow colored squares with different measures from the mean, the five equal blue squares are like the average square distance from the mean. Instead of having five different numbers to represent how spread out the data is from the mean, this equalizing process lets us have a single average number. That’s the standard deviation.

pic4.PNG


I’m not totally clear on everything, but this visualization and typing this out has really help me grok standard deviation better than I had before.

I created a geogebra applet. You can either drag the red points up and down (for the five points in the data set), or manually enter the five numbers.

https://www.geogebra.org/m/EatncEg2

My recommendation is something like this:

  1. {4, 4, 4, 4, 4}. Make a prediction for what the standard deviation will be. Then set the five numbers and look at what you see. What is the standard deviation? Were you right?
  2. {8, 8, 8, 8, 8}. Make a prediction for what the standard deviation will be. Then set the five numbers and look at what you see. What is the standard deviation? Were you right?
  3. Set the five numbers to {2, 4, 4, 4, 6} and look at what you see. What is the standard deviation?
  4. Consider the number {5, 7, 7, 7, 9}. Make a prediction if the standard deviation will be higher or lower or the same as the standard deviation in #3. Then set the five numbers to {5, 7, 7, 7, 9} and look what you see. What is the standard deviation? Were you right?
  5. Consider the numbers {3, 7, 7, 7, 11}. Make a prediction if the standard deviation will be higher or lower or the same as the standard deviation in #4. Explain your thinking. Then set the five numbers to {3, 7, 7, 7, 11} and look at what you see. What is the standard deviation? Were you right?
  6. Consider the numbers {3, 6, 7, 8, 11}. Make a prediction if the standard deviation will be higher or lower or the same as the standard deviation in #5. Explain your thinking. Then set the five numbers to {3, 6, 7, 8, 11} and look at what you see. What is the standard deviation? Were you right?
  7. What do you think the standard deviation of {4, 8, 8, 8, 12} be? Why? Check your answer with the applet.
  8. Can you come up with a different data set which matches the standard deviation in #6? Explain how you know it will work.
  9. Set the five numbers to {4, 4, 4, 4, 4}. Initially there are no squares visible. The standard deviation is 0. Now drag one of the numbers (red dots in the applet) up. Describe what the squares look like when they appear? Eventually drag that number to 15. What do you notice about the standard deviation? Use your understanding of what happened to describe how a single outlier in a data set can affect the standard deviation

Okay, I literally just whipped the applet up in 35 minutes, and only spent the last 15 minutes coming up with these scaffolded questions. I’m sure it could be better. But I enjoyed thinking through this! It has helped me get a geometric/visual sense of standard deviation.


Now time to eat dinner!!!

 Update: a few people have pointed out that the n in the denominator of the standard deviation formula should be n-1. However that would be for the standard deviation formula if you’re taking a sample of a population. This post is if you have an entire population and you’re figuring out the standard deviation for it. 

[1] One might ask why square the distance to the mean, instead of taking the straight up distance to the mean (so the absolute value of each number minus the mean). The answer gets a bit involved I think, but the short answer to my understanding is: the square function is “nice” and easy to work with, while an absolute value function is “not nice” because of the cusp.

Quadratic Play

CAVEAT: There isn’t any deep math in this post. There aren’t any lessons or lesson ideas. I was just playing with quadratics today and below includes some of my play.

I’ve been struggling with coming up with a precalculus unit on polynomials that makes some sort of coherent sense. You see, what’s fascinating about precalculus polynomials is that to get at the fundamental theorem of blahblahblah (every nth degree polynomial has n roots, as long as you count nonreal roots as well as double/triple/etc. roots), one needs to start allowing inputs to be non-real numbers. To me, this means that we can always break up a polynomial into n factors — even if some of those factors are non-real. This took up many hours, and hopefully I’ll post about some of how I’m getting at this idea in an organic way… If I can figure that way out…

However more recently in my play, I had a nice realization.

In precalculus, I want students to realize that all quadratics are factorable — as long as you are allowed to factor them over complex numbers instead of integers. (What this means is that (x-2)(x+5) is allowed, (x-5.2)(x-1.2) is allowed, but so are (x-i)(x+i) and (x-5+2i)(x-5-2i) and (x-\sqrt{2}+\sqrt{7}i)(x-\sqrt{2}-\sqrt{7}i). (And for reasons students will discover, things like (x+i)(x+2) won’t work — at least not for our definition of polynomials which has real coefficients.)

So here’s the realization… As I started playing with this, I realized that if a student has any parabola written in vertex form, they can simply use a sum or difference of squares to put it in factored form in one step. I know this isn’t deep. Algebraically it’s trivial. But it’s something I never really recognized until I allowed myself to play.

pic1.png

I mean, it’s possibly (probable, even) that when I taught Algebra II ages ago, I saw this. But I definitely forgot this, because I got such a wonderful a ha moment when I saw this!

And seeing this, since students know that all quadratics can be written in vertex form, they can see how they can quickly go from vertex form to factored form.

***

Another observation I had… assuming student will have previously figured out why non-real roots to quadratics must come in pairs (if p+qi is a root, so is p-qi): We can use the box/area method to find the factoring for any not-nice quadratic.

pic2pic3pic4pic5

And we can see at the bottom that regardless of which value of b you choose, you get the same factoring.

I wasn’t sure if this would also work if the roots of the quadratic were real… I suspected it would because I didn’t violate any laws of math when I did the work above. But I had to see it for myself:

pic7.png

As soon as I started doing the math, I saw what beautiful thing was going to happen. Our value for b was going to be imaginary! Which made a+bi a real value. So lovely. So so so lovely.

***

Finally, I wanted to see what the connection between the algebraic work when completing the square and the visual work with the area model. It turns out to be quite nice. The “square” part turns out to be associated with the real part of the roots, and the remaining part is the square associated with the imaginary part of the roots.

pic 8.png

***

Will any of this make it’s way into my unit on polynomials? I have no idea. I’m doubtful much of it will. But it still surprises me how I can be amused by something I think I understand well.

Very rarely, I get asked how I come up with ideas for my worksheets. It’s a tough thing to answer — a process I should probably pay attention to. But one thing I know is part of my process for some of them: just playing around. Even with objects that are the most familiar to you. I love asking myself questions. For example, today I wondered if there was a way to factor any quadratic without using completing the square explicitly or the quadratic formula. That came in the middle of me trying to figure out how I can get students who have an understanding of quadratics from Algebra II to get a deeper understanding of quadratics in Precalculus. Which meant I was thinking a lot about imaginary numbers.

That’s what got me playing today.


A New Insight on the Famous Painted Block Problem

There is a famous, well-known problem in the world of “rich math tasks” that involves taking an nnn cube and painting the outside of it. Then you break apart the large cube into unit cubes (see image below cribbed from here for n=2 and n=3):

cubes

Notice that some of the unit cubes have 3 painted faces, some have 2 painted faces, some have 1 painted face, and some have 0 painted faces.

The standard question is: For an nnn cube, how many of the unit cubes have 3 painted faces, 2 painted faces, 1 painted face, and 0 painted faces.

[In case you aren’t sure what I mean, for a 3 x 3 x 3 cube, there are 8 unit cubes with 3 painted faces, 12 unit cubes with 2 painted faces, 6 unit cubes with 1 painted face, and 1 unit cube with 0 painted faces.]

Earlier this year, I worked with a middle school student on this question. It was great fun, and so many insights were had. This problem comes highly recommended!

Today we had some in house professional development, and a colleague/teacher shared the problem with us, but he presented an insight I had never seen before that was lovely and mindblowing.

Spoiler alert: I’m about to give some of the fun away. So only jump below / keep reading if you’re okay with some some spoilers.

(more…)

Radical Musings

This is a short post to archive some thinking I did on the subway home from work today. I had a Geometry class today and it was clear to me that their understanding of radicals was … not so good. And I don’t think it is their fault. I remember teaching Algebra II years ago and tried building up some conceptual understanding so puppies don’t have to die… and it was tough and I didn’t really succeed:

puppy

(Poster made by the infinitely awesome Bowman Dickson.)

I also remember having this exact same conversation with my co-teacher last year. We considered the following “thought exercise.”

How would you explain to a student in Algebra I why \sqrt{15}=\sqrt{5}\sqrt{3}?

I would like to add the corollary “thought exercise”:

How would you explain to a student in Algebra I why \sqrt{15}\neq\sqrt{10}+\sqrt{5}?

And so on the subway home, I thought about this, and had the same insight I had last year.

We define (at least at the Algebra I level) \sqrt{15} to mean “the number you multiply by itself that yields 15.”

I want to highlight the concept more than the notation, so let’s call that number \square.

So for us \square is “the number you multiply by itself that yields 15.”
Now let’s similarly call \heartsuit “the number you multiply by itself that yields 5.”
And let’s call \triangle “the number you multiply by itself that yields 3.”

We know from this \square \cdot \square=15. Why? Because that’s the definition of “square” for us.

But we also know \heartsuit \cdot \heartsuit=5 and \triangle \cdot \triangle=3 for the same reason.

Thus we know \heartsuit \cdot \heartsuit \cdot \triangle \cdot \triangle=\square \cdot \square.

Here’s the magic.

Let’s rearrange:

\heartsuit \cdot \triangle \cdot \heartsuit \cdot \triangle = \square \cdot \square .

Study this a minute. It takes a second (or it might for students) to see that \heartsuit \cdot \triangle = \square.

Now remember I used symbols because I wanted to focus on the meaning of these objects, not the notation.Let’s convert this back to our “fancy math notation.”

\sqrt{5} \sqrt{3}=\sqrt{15}

So that gets at our first “thought exercise.”

I wonder if trying the same with the second thought exercise might work? The tricky part is that we’re trying to show a negative statement. I know… I know… most of you probably say “hey, just show the kids \sqrt{1+4}\neq\sqrt{1}+\sqrt{4}.” But that doesn’t stick for my kids!

So let’s try it: for us \square is “the number you multiply by itself that yields 15.”
Now let’s similarly call \clubsuit “the number you multiply by itself that yields 10.”
And let’s call \spadesuit “the number you multiply by itself that yields 5.”

So:
\square \cdot \square=15.
\clubsuit \cdot \clubsuit=10
\spadesuit \cdot \spadesuit=5

Then challenge students do something similar to show that \square = \clubsuit + \spadesuit. They hopefully will start failing in their endeavor!

I predict they will start with: \square \square = \clubsuit \clubsuit + \spadesuit \spadesuit. Yay. That’s true… So from that true statement, they are going to try to show that \square = \clubsuit + \spadesuit.

But they can’t really go anywhere from here. They’re stuck. I still predict some weaker students may say: “But clearly we can just say \square =\clubsuit + \spadesuit. It’s like you have “half” of each side of the equation!” But it is at this point you can ask students to do two things:

1) Ask ’em to show the algebraic steps that allow them to make that statement. There won’t be valid steps. And in this process, you can see what other horrible algebraic misconceptions your students have (if any).

2) Or say: okay, let’s see if you’re right. If \square =\clubsuit + \spadesuit, then I know \square \square=(\clubsuit+\spadesuit)(\clubsuit+\spadesuit). And as soon as you start distributing those binomials, they’ll see they don’t get \square \square = \clubsuit \clubsuit + \spadesuit \spadesuit (our original statement).

Okay I just needed to get some of my initial thoughts out. Maybe more to come as I continue thinking about this…


Rational Function Headbandz

TL;DR: An interactive activity having kids ask each other questions to guess the rational function graph they have on their foreheads.

***

I’m going to make a short post inspired by Twitter Math Camp 2013 (TMC13), rather than TMC14. Both @calcdave and I led morning sessions for precalculus teachers. Through that morning session, some nice end-products were created — an organization for the curricula, actual classroom activities — and you should feel free to check them out here. [1]

@calcdave and I brainstormed how we could get people in the morning session to know each other, but make sure we have math content in that activity. We came up with Rational Function Headbandz, which was inspired by this post on the agony and dx/dt.

The setup: There are a bunch of cards (they could be index cards). On the front of them is an graph of a rational function. On the back is the equation of the rational function. The cards are attached to ribbons or headbands, so that when attached to the forehead only other people can see the graph on the front of the card — not the person wearing it. Sort of like this image below. You can re-imagine how to create these cards/headbands so they work for you.

headbandz

The Goal: Since this was an introductory activity, participants picked one of two goals for themselves… (a) to figure out as many features as they could of their rational function and to sketch a graph from those features, or (b) to figure out the equation of their rational function.

To Play: I put all the cards/headbands on the table, and covered up the graph with post-its so the participants couldn’t see the graphs. I wrote on the post it if the graphs were graphs I considered sort of challenging, pretty darn challenging, or wow-you’re-going-for-it challenging! Then they attached their headbands to their head, and had someone else remove the post-it note.

Before starting they were told the following things about their rational functions:

  • All the graphs are of rational functions.
  • Some might be plain old polynomials. (Rational functions with the a 1 in the denominator!)
  • If written in the most factored form, none of the terms has degree of more than two
  • If written in the most factored form, most of the coefficients are really nice

Each person carried around with them a notebook, and they were allowed to ask up to three questions about the graph to each person (and a get to know you question to each person!). The rub? All questions had to be answered with a single word or a single number.

A valid question: “How many holes does my graph have?”

A valid question: “Is my rational function a line?”

A valid question: “Does my rational function cross or kiss the x-axis at x=3?”

An invalid question: “What is the coordinate of the hole?” (Because the answer will have two numbers as an answer — an x-coordinate and a y-coordinate.) You could instead ask “What is the x-coordinate of one of the holes of my graph?” and then follow up with “For the hole with x-coordinate BLAH, what is the y-coordinate?”

After three questions, they move on to a different person. Then another. Et cetera. From these questions they were supposed to gather information about their graph, and possibly about their equation.

You stop the game whenever you want. Everyone looks at their graphs and equations, and ooohs!, dohs!, and aaahs! result.

And then if you have time, you can debrief it with students by talking about what they thought was important information to gather in order to sketch or come up with the equation for the graph (holes? x-intercepts? y-intercepts? vertical asymptotes? horizontal asymptotes? slant asymptotes? end behavior?). And then if you had time you could have individual students present their graph, their thought process, and their solution.

Our Graphs: We really varied the nature of the graphs because we were working with precalculus teachers and we didn’t know their ability level with the material. And also I know I emphasize in my class working backwards from the graph to the equation, but that isn’t a standard thing taught. So I would highly recommend creating graphs of your own based on the level of work that you’re doing in your class.

[.pdf, .docx]

Trouble Spots: One thing that was challenging for us when we played this was what someone does when they have figured out their own equation/graph. They came to us and we confirmed. But then what? We should have anticipated this because we had such varying levels of difficulty for graphs. I wonder if a good solution would be to then try to figure out the equation for the rational functions of others when they are being asked questions.

Another thing to keep in mind is that this will take a longer time than you think. We used this as a get-to-know-you activity, and so that extended everything even more. (In your class, your students probably won’t be using this as a get to know you activity.)

Alternatives: Just as I adapted this from a teacher using them for trig functions/graphs, these can easily be adapted for other topics. Some initial ideas:

Geometry vocabulary review: Students have a vocabulary word on their heads. They only can ask questions with one-word answers. (e.g. “Does it have to do with parallel lines?”)

Polynomial graphs (instead of rational function graphs), or even just parabolas [update: Mary did this!], or even just lines.

Students have derivative graphs on their heads, and they need to come up with a sketch of the original function (for this they should be allowed more than one-word answers).


[1] One thing I worked on in a group with four other people is how to get students to understand inverse trigonometric functions (a topic we collectively decided was challenging for students to wrap their heads around). I blogged about the result of our work here. I used it in class this past year, and although I didn’t use it completely as intended, it did really push home the meaning of what sine and cosine were graphically (the y- and x-coordinates on a unit circle corresponding to a given angle) and then what inverse sine and inverse cosine were graphically (the angles that are corresponding to a given y- or x-coordinate). Check it out!