Author: samjshah

Related Rates, Yet Another Redux

I posted in 2008 how I didn’t actually find related rates all that interesting/important in calculus. The problems that I could find were contrived, and I didn’t quite get the “bigger picture.” In 2011, I posted again about something I found from a conference that used Logger Pro, was pretty interesting, and helped me get at something less formulaic.

I still don’t know how I feel about related rates. I’m torn. Part of me wants to totally eliminate them from the curriculum (which means I can also possibly eliminate implicit differentiation, because right now I see one of the main purposes of implicit differentiation is to prime students for related rates). Part of me feels there is something conceptually deeper that I can get at with related rates, and I’m missing it.

I still don’t have a good approach, but this year, I am starting with the premise that students need to leave with one essential truth:

Often times, as we change one thing, it affects a number of other things. However, the way that the other things are affected can vary greatly. 

Right now, to me, that’s the heart of related rates. (To be honest, it took some conversation with my co-teacher before we were able to stumble upon this essential understanding.)

In order to get at this, we are starting our related rates unit with these two worksheets. A nice bonus is that it gets students to think about the shape of a graph, which is what we’ll be embarking on next.

The TD;DR for the idea behind the worksheets: Students study a circle which has it’s radius increase by 1 cm each second, and see how that changes the area and circumference. Then students study a circle which has it’s area increase by 10 cm^2 each second, and see how that changes the radius and circumference. The big idea is that even though one thing is changing, that one thing affects a number of different things, and it changes them in different ways.

[.docx] [.docx]

(A special thanks to Bowman for making the rocket and camera problem dynamic on Geogebra.)

It’s not like this is a deep investigation or they come out knowing anything super special. But the main takeaway that I want them to get from it becomes pretty apparent. And what’s really powerful (for me, as a teacher trying to illustrate this essential understanding) is seeing the graphs of how the various thing change.

***

IMAG2906

I had students finish the first packet one night. Before we started going over it, or talking about it, I started today’s class asking for a volunteer to blow up balloons. (We got a second volunteer to tie the balloons.) While he practiced breathing even breaths, I tied and taped an empty balloon to the whiteboard.

Then I asked our esteemed volunteer to use one breath to blow up the first balloon. Taped it up. Again, for two breaths. Taped. Et cetera until we got a total of six balloons taped.

Then I asked what things are measurable in the balloons.

Bam. List.

(We should have listed more. Color. What it’s made of. Thickness of rubber.]

Then I asked what we did to the balloon.

Added volume. A constant volume (ish) in each balloon.

Which of the other things changed as a result?

How did they change?

This five minute start to class reinforced the main idea (hopefully). We changed one thing. It changed a bunch of other things. But just because one thing changed in one particular way doesn’t mean that everything changed in that same way. For example, just because the volume increased at a constant rate doesn’t mean the radius changed at a constant rate.

***

 This is about all I got for now. I’m going to teach the rest of the topic the way I always do. It’s not up to my personal standards, but I still am struggling to get it there. I suppose to do that, I’ll have to see a more nuanced bigger picture with related rates, or find something that approaches what’s happening more visually, dynamically, or conceptually.

PS. The more I mull it over, the more I think that geogebra has to be central to my approach next year… teaching students to make sliders to change one parameter, and having them develop something that dynamically illustrates how a number of other things change. And then analyzing how those things change graphically and algebraically.

(A simple example: Have a rectangle where the diagonal changes length… what gets affected? The sides, the angle between the diagonal and the sides of the rectangle, the area, the perimeter, etc. How do each of these things get affected as the diagonal changes?)

Quick Questions on Proving Trig Identities

I’m sure that this question has been asked in a million high school math offices, so apologies for the rudimentary nature of the question.

I’m teaching Precalculus for the first time. And I’m about to teach proving trig identities, like:

\frac{\sin(x)}{\sin(x)-\cos(x)}=\frac{1}{1-\cot(x)}

I understand that the standard ways to prove trig identities is:

(a) pick one side of the equation, and keep morphing it until it matches the second side of the equation

(b) individually modify both side of the equations independently until they equal the same thing.

I always learned that what you cannot do is start mixing both sides of the equations. So, for the equation above, you can’t cross multiply to get:

\sin(x)(1-\cot(x))=1(\sin(x)-\cos(x))

and keep on simplifying both sides to show they are the same and the equality is true.


The reasons I’ve heard this is not allowed:

1. Because I said so.

2. You can only cross multiply if you know the equality is true. But that’s precisely what you’re trying to prove. You are assuming the statement is true to prove the statement is true.

However, both explanations are unsatisfying to me. The first one is for obvious reasons. My objection with the second one is that it seems to always work for these problems. Although I know it is logically unsound, I can’t quite pinpoint why with a concrete example to demonstrate it.. 

My questions are the following:

What do you do to explain to your kids why you can only work the sides of the equality independently? Does it convince them?

Does anyone have a good example involving trigonometric identities that illustrates that bad things happen when you don’t solve the sides independently, but start mixing them together? Like proving something that isn’t true actually is true… or proving something true that actually isn’t true?

Thanks for any help. I feel a little foolish, like I’m missing something obvious. Like I should know this. But hey, if I knew everything, I wouldn’t need all y’all.


Guest Post: Conics Project

This is a guest post from my friend Liz Wolf.

***

“The conics section comes at a tough time in our curriculum.  It’s a few weeks after Spring Break, and kids are always antsy in class and have major spring fever.  I wanted a way to make conics less abstract and show the kids how often they come up in every day life.  I came up with a project that not only got them outside, but also got them looking at things in a different way.  The photo of the water droplet on the swing set was my favorite.  The students really embraced this and I was impressed with how well they embraced GeoGebra having never used it before.”

***

Below are some examples of final products from her class, and the instruction sheet she used.

Image

Image

Image

Image

Update: Liz sent me her Geogebra instruction sheet!

Swampped

This is one of those days where the one good thing was hard to find. I had to reprimand one class for not doing their work at home, I am having to deal with juggling because a ton of students have been out, I’m dealing with a lot of this and that, and I have a HUGE amount on my plate for this weekend. Like: impossibly large amount of stuff to do. So my anxiety is through the roof. And, yes, I have that tickle in the back of my throat which could mean something or it could mean nothing.

But that’s precisely why we need this blog. So I’m going to post some of the small good things that happened. None of them were GOOD (like, enough to undo my stress) but they were positive.

(1) Another multivariable calculus student turned in her aweeeeesome 3D function which is aweeesome possum…Image


(2) Some kids were really excited about showing me some of the stuff they did for their roller coasters in their calculus projects (which were due today).

(3) I took over a colleagues precalculus class while she took my multivariable calc kids (and one of her classes) to the Museum of Mathematics… and her kids were working on the same project mine are (the family of curves project). Her kids were soooo into it and were coming up with some stunning, beyond stunning in fact, pieces of artwork.

(4) A former kid who served for all my years on the SFJC came back to visit and we caught up after school. It was nice to hear what exciting things he has planned in the next five months!

That’s about it. When I’m overwhelmed and overextended, and when a lot of kids have their own things I’m dealing with, I can’t appreciate these small moments. So I am glad I took the time to force myself to think of these small moments, in a sea of mediocre ones.

Families of Curves #2

So today I started the Family of Curves project in Precalculus. Students are going to be given three in class days to work on this, and about a week or two of out-of-class to finish it on their own.

I started class showing around 4 or 5 minutes of this Vi Hart video with no introduction:

Then I showed a whole bunch of pictures… of tessellations, Escher prints, one of the things they were going to be creating on geogebra [but without telling them it was not a famous artist], and a few beautiful prints and the website for Geometry Daily.

Then I had them take out their laptops, and just get started working on Geogebra. The packet below takes them through the sequence command, and then shows them how the sequence command can create a family of curves…

Here’s the instructions getting kids started on Geogebra and what’s expected of them…

[.docx]

Note: My kids are getting more and more fluent with Geogebra… We have been using it on-and-off all year at various times.

They were silently working the entire class. I put on some music, and they started talking a bit. But since it’s an individual project, I suppose I can’t expect a lot of talking. Some kids have been asking me “how do you make circles?” and one student asked me how to fill in circles…

It took them pretty much the whole day today to do the geogebra introductory stuffs, so they didn’t all get to play around with their own functions. I expect tomorrow will be pretty awesome to watch them tinker and explore, and get cool things.

I don’t know if they are “into” this yet. I’ll see if I get any anecdotal evidence tomorrow.

One Good Thing

A short post:

For those of you who don’t know, Rachel Kernodle (@rdkpicklehttp://sonatamathematique.wordpress.com/) has started a group blog called “one good thing.” She wrote about it here, and you can visit the blog here.

Image

The idea is that even in the most frustratingly upsetting days as teachers, there is at least one good thing that happens — as long as you keep your eyes open to it. We may feel we suck, we may get all arrrrgh at students, a lot of random stress can take over and fill us with anxiety… and we get our blinders on, and lose sight of the bigger picture. Looking for one good thing each day helps us see the bigger picture when our vision narrows. And it also helps us archive the little moments, which are oh so important!

Right now there are about 7 authors posting regularly. This is one of the many projects that math teachers have going on (others are here)! I know Rachel wants to invite others who want to contribute regularly or semi-regularly to join in (it’s not an exclusive club!) — so she said you can throw your email in the comments here in the next couple days and she’ll add you as an author to the blog. Or you can tweet her to get added or find out more information. That simple!

What’s nice is this blog will soon be populated with a million little stories from a bunch of (math) teachers all around the world. A beautiful pastiche of why we teach, with concrete, on-the-ground examples.

(My entries on the “one good thing” blog are archived here.)

Families of Curves

When I put out my call for help with Project Based Learning, I got a wonderful email from @gelada (a.k.a. Edmund Harriss of the blog Maxwell’s Demon) with a few things he’s done in his classes. And he — I am crossing my fingers tight — is going to put those online at some point for everyone. To just give you a taste of how awesome he is, I will just say that he was in NYC a few years ago and agreed to talk to my classes about what it’s like to be a real mathematician (“like, does a mathematician just like sit in a like room all day and like solve problems?”), and have kids think about and build aperiodic tilings of the plane.

Anyway, he sent me something about families of curves, and that got my brain thinking about how I could incorporate this in my precalculus class. Students studied function transformations last year in Algebra II, and we reviewed them and applied them to trig functions. But I kinda want to have kids have some fun and make some mathematical art.

First off, I should say what a family of curves is.

family

That’s from Wikipedia. A simple family of curves might be y=kx which generates all the lines that go through the origin except for the vertical line.

lines

I made this in Geogebra with one command:

Sequence[k*x, k, -10, 10, 0.5]

This tells geogebra to graph y=kx for all values of k from -10 to 10, increasing each time by 0.5.

Okay, pretty, but not stunning. Let’s mix things up a bit.

lines 2

Sequence[k*x+k^2, k, -10, 10, 0.1]

Much prettier! And it came about by a simple modification of the geogebra command. Now for lines with a steep slope, they are also shifted upwards by k^2. This picture is beautiful, and gives rise to the question: is that whitespace at the bottom a parabola?

Another one?

sin

Sequence[1/k*sin(k*x),k,-10,10,0.2]

And finally, just one more…

tan

Sequence[1/k*tan(x)+k,k,-10,10,0.1]

Just kidding! I can’t stop! One more!

sec

Sequence[k sec(x)+(1/k)*x,k,-10,10,0.25]

What I like about these pictures is…

THEY ARE PRETTY

THEY ARE FUN TO MAKE

THEY ARE SUPER EASY TO MAKE & TINKER WITH

THEY MAKE ME WANT TO MAKE MOAR AND MOAR AND MOAR

And then, if you’re me, they raise some questions… Why do they look like they do? What is common to all the curves (if anything)? Does something special happen when k switches from negative to positive? What if I expanded the range of k values? What if I plotted the family of curves but with an infinite number of k values? Do the edges form a curve I can find? Can I make a prettier one? Can I change the coloring so that I have more than one color? What would happen if I added a second parameter into the mix? What if I didn’t vary k by a fixed amount, but I created a sequence of values for k instead? Why do some of them look three-dimensional? On a scale of 1 to awesomesauce, how amazingly fun is this?

You know what else is cool? You can just plot individual curves instead of the family of curves, and vary the parameter using a slider. Geogebra is awesome. Look at this .gif I created which shows the curves for the graph of the tangent function above… It really makes plain what’s going on… (click the image to see the .gif animate!)

sec animation

Okay, so I’m not exactly sure what I’m going to do with this… but here’s what I’ve been mulling over. My kids know how to use geogebra. They are fairly independent. And I don’t want to “ruin” this by putting too much structure on it. So here’s where I’m at.

We’re going to make a mathematical art gallery involving families of curves.

1. Each student submits three pieces to the gallery.

2. Each piece must be a family of curves with a parameter being varied — but causing at least two transformations (so y=kx^2 
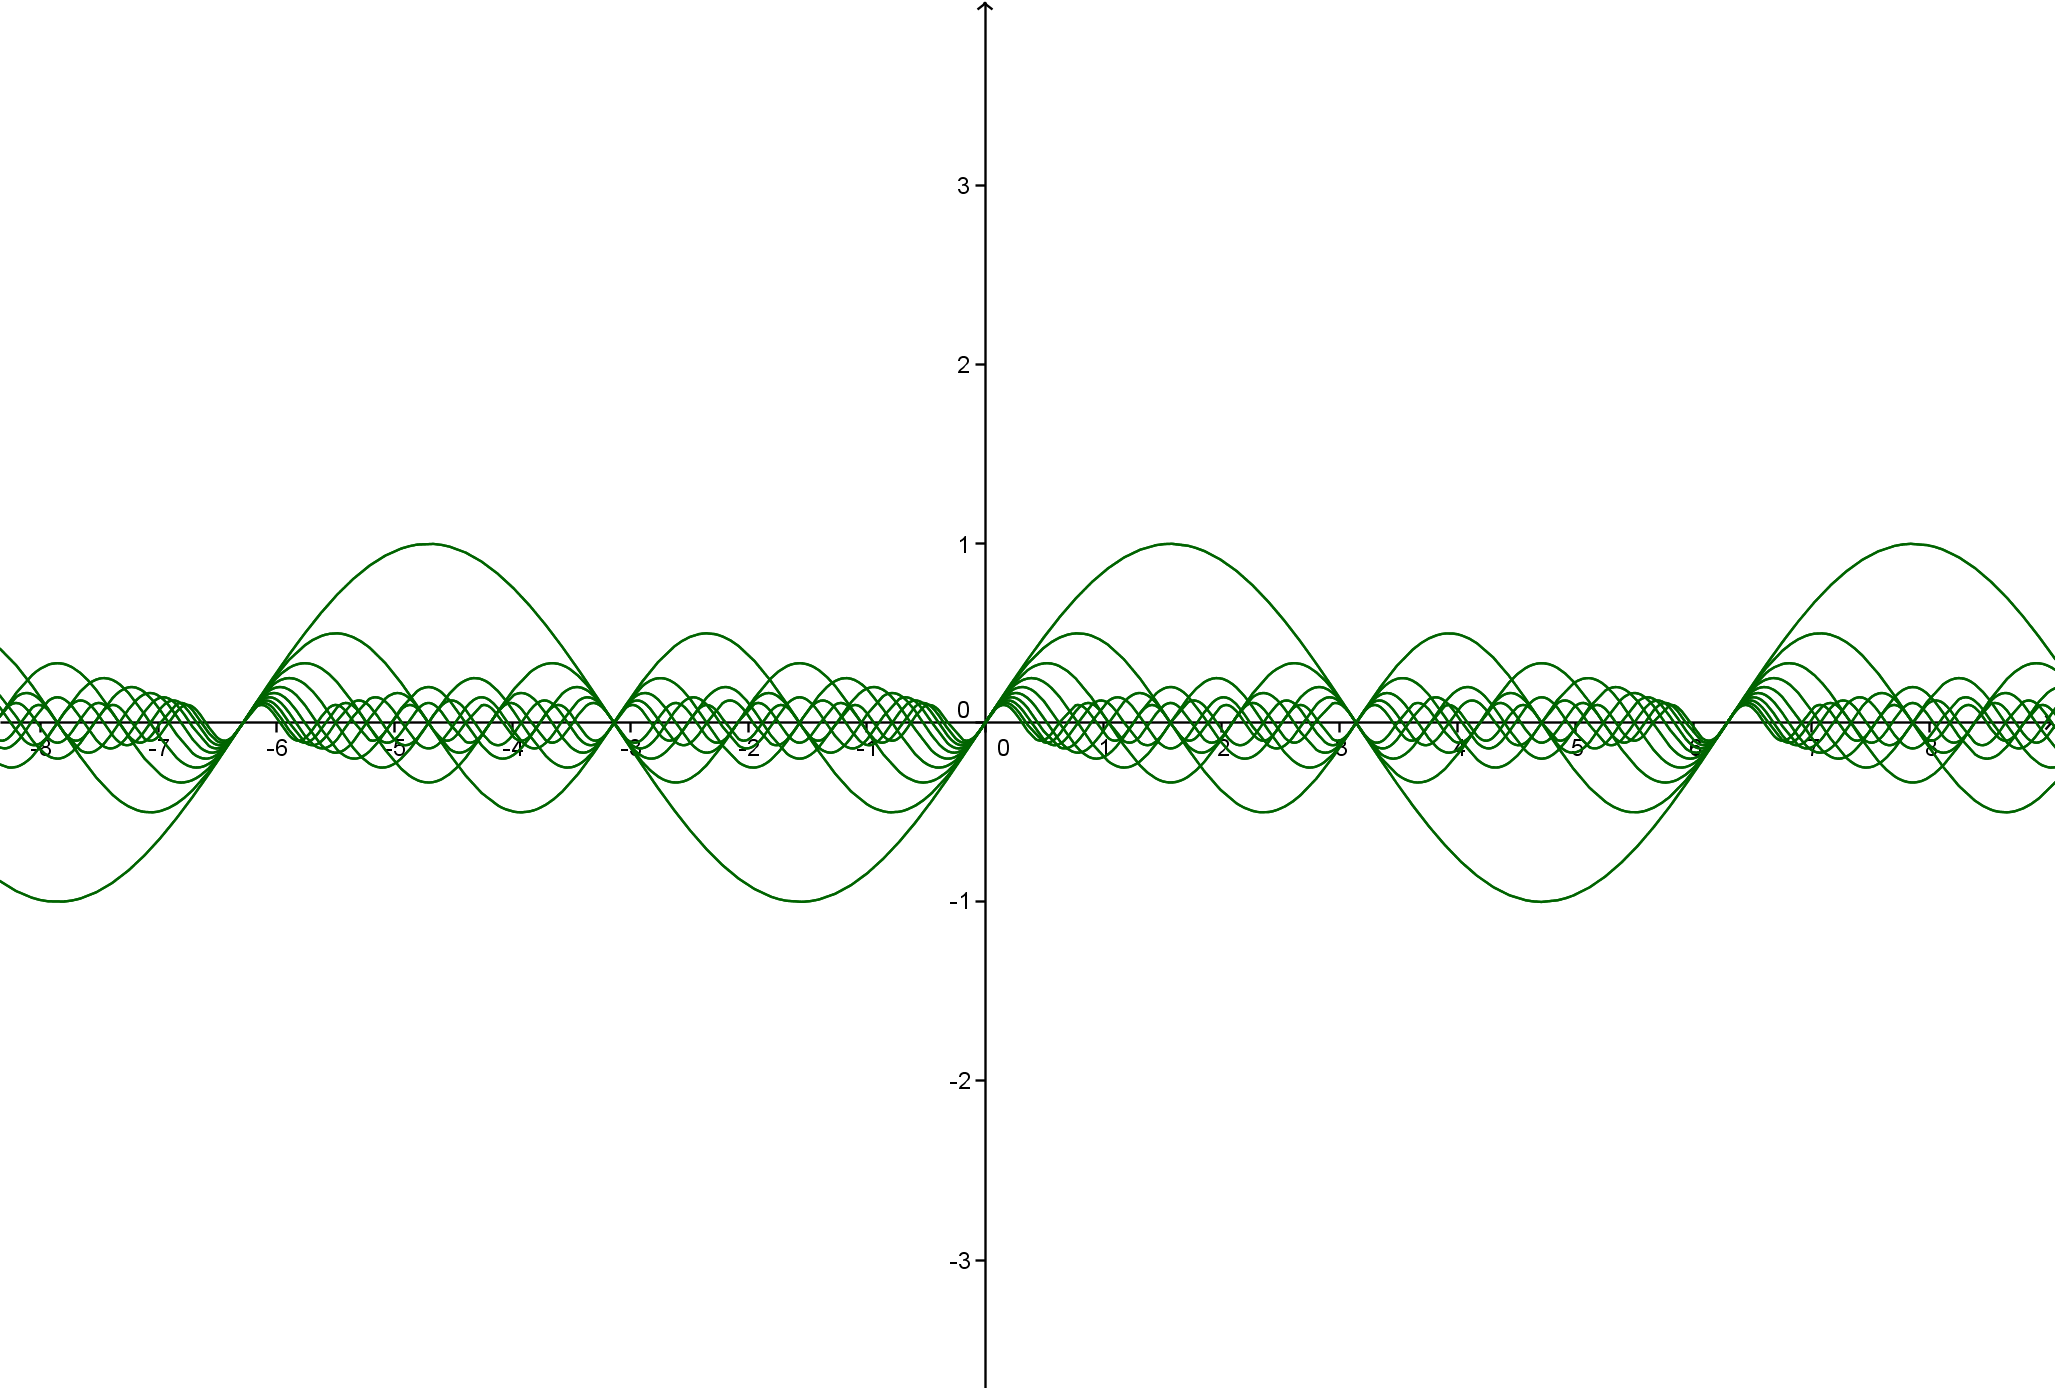
won’t count because it just involves a vertical stretch, but y=k(x-k)^2 would be allowed because there is a vertical stretch and horizontal shift).

3. At least one of the three pieces must involve the trig function(s) we’ve learned this year.

4. The art pieces must be beautiful… colors, number of curves in the family of curves, range for the parameter, etc., must be carefully chosen.

Additionally, accompanying each piece must be a little artists statement, which:

0. Has the title of the piece

1. States what is going on with each curve which allows the whole family of curves to look the way they do, making specific reference to function transformations.

2. Has some plots of some of individual curves in the family of curves to illustrate the writing they’ll be doing.

3. Has a list of things they notice about the graph and things they wonder about the graph.

At the end, I’ll photocopy the pieces onto cardstock and make a gallery in the room — but without the artist’s names displayed. I’ll give each student 5 stickers and they’ll put their stickers next to the pieces they like the most (that are not their own). I’ll invite the math department, the head of the upper school, and other faculty to do the same. The family of curves with the most stickers will win something — like a small prize, and for me to blow their artwork into a real poster that we display at the school somewhere. And hopefully the creme de la creme of these pieces can be submitted to the math-science journal that I’m starting this year.

Right now, I have a really good feeling about this. It’s low key. I can introduce it to them in half a class, and give them the rest of that class to continue working on it. I can give them a couple weeks of their own time to work on it (not using class time). And by trying to suss out the family of curves and why it looks the way it does, it forces them to think about function transformations (along with a bunch of reflections!) in a slightly deeper way. It’s not intense, and I’ll make it simple to grade and to do well on, but I think that’s the way to do it.

What’s also nice is when we get to conic sections, I can wow them by sharing that all conics are generated by r(\theta)=\frac{k}{1+k\cos(\theta)}
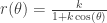
. In other words, conic sections all can be generated by a single equation, and just varying the parameter k. Nice, huh?

PS. Since I am not going to do this for a few weeks, let me know if you have any additional ideas/thoughts to improve things!