So today I had this experience where this precalculus test I gave was a bit of a bloodbath. Not for everyone, but for more than usual. In a way where I cringe, cry out to the high heavens, and scream:
WHYYYYYYYYYYYYYYYYYYYYYY?
The reason is because I felt pretty proud of the way I have been introducing the material. You see, in precalculus this year, the kids are coming up with everything on their own. I don’t give them anything.* And thus far they’ve been doing well with this. And during this unit, even though I didn’t quite have the same amount of time to create everything to my best ability (I relied a lot on the textbook for this stuff), I felt pretty confident about my kids’s understanding.
So I have to wonder: Where did I go wrong as a teacher? What was different about this unit than the others?
First off, this unit was some pretty heavy stuff. We were deriving and applying the trig formulas, and then we were solving more complicated trig equations (they had done basic trig equations previously). All in all, we took a total of 8 days to do this. I should also note that this is an advanced class, and they have been doing a lot of collaborative work this year.
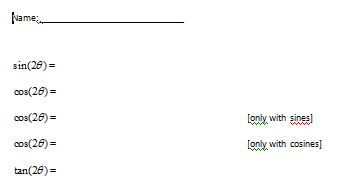
FYI: these were the trig formulas we derived and applied… this is the “trig formula family tree” I made for them.
And for this unit, I led class in a pretty routine way. Each day I had a packet for the kids to work on. They would work on the warm ups with their groups (which were designed to activate prior things they knew but forgot, and have kids make some connections on their own). After 5-10 minutes, we would all talk through the warmup problems together.
Then I would let each group work on their own. I would walk around and facilitate, nudge, question, and answer questions. On some packets, I would have special places where I told kids to “draw in a heart, and call me over when you get to the heart.” (But to be honest, overall, I think I was throwing myself into the groups less than I usually do this unit, as I’ve been trying to let go.)
Then class would end. Most groups were where they should have been… close to done with the packet, and ready to start working on the book problems. These book problems varied in difficulty from the routine “can you do something simple?” to the “okay, apply this in a moderately deep way.” For this unit, I did assign more nightly work than I normally assign, because I knew that to get good at this stuff involves a lot of practice. (I don’t think that is true for everything in math, btdubs.)
Then at the start of the next class, I would have one set of my handwritten solutions per each table (that way, three kids have to share, and thus talk!). I would give kids 5-10 minutes to compare their answers, talk with their groups to figure out things they were doing wrong, and then we would come together as a class and I would field questions that groups couldn’t answer. Then we started a new packet, and the process continued like that for most days. [We did have a bit where we did a paper folding activity, which was pretty cool.]
To see what these packets look like, I combined all of them here so you can scroll through them. I highlighted some of the problems/questions which I thought were good at getting at something hard/interesting/conceptual:
As you can see, these aren’t really great. Not bad either, though. [1]
So where did things go wrong?
When I look through the tests, here are some things I noticed as a trend:
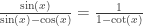
- Kids struggled with some of the basic “apply the formula” questions
- Kids had trouble figuring out which sign to use when using the half angle formulas (e.g.
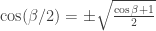 ) [2]
) [2]
- Kids really nailed the conceptual explanation part of “how many solutions does this trig equation (e.g.
 ) have on the interval $\latex 0\leq\theta<2\pi$?” question
- Kids struggled with remembering that when you take the square root of both sides, you get two solutions (so
 is really two equations to solve)
- Kids did a pretty good job of deriving the trig formulas
- Even though kids did a pretty good job on the “how many solutions does this trig equation have?” they didn’t find all the solutions to the basic trig equations given.
As far as I can tell, here were the contributing factors (in no particular order):
(a) Lots and lots of sickness. I still have 5 kids who haven’t taken it (out of 19).
(b) I thought I was getting formative feedback when I gave regular little mini non-graded “do you remember the trig formulas we’ve derived” at the start of some classes…
And honestly, I felt proud that I have been making a conscious effort to collect this formative feedback. But now I see it wasn’t the right formative feedback.
(c) I usually get a good amount of formative feedback in Precalculus. Mainly I do it by collecting of the nightly work, marking it up, and handing it back. Thus I usually know what students are understanding and what they are not, and they also know what they understand and what they don’t. However, because I was swamped, I didn’t really do that. Maybe once in eight days? So each day, kids got to compare their own work to my solutions, which I thought would at least give THEM feedback… But I never got to see what kinds of mistakes they were making, or where they were getting tripped up, not in detail and not in a big-picture way. So I didn’t build these things into the lessons… which is important because…
(d) This material is hard. Harder than some of the previous units/ideas. That’s because this unit required conceptual understanding, juggling a lot of memorized formulas, a bunch of intuition (as to how to start solving the trig equations), and a lot of “fact” information (like where in the unit circle is  ?). It’s just pulling a lot of stuff together.
(e) I should have spent more time reminding them of the trig equations they had previously solved. I assumed that they remembered all of that stuff we did weeks ago and could apply it. I jumped in too fast.
(f) The test was a bit too long. The kicker is, I thought it was too long, so I cut some stuff out. I was trying to be conscious of that. Well, the road to hell…
So there we are. Surprisingly, typing this out has made me feel a lot better. I feel like I now have a better grasp on why something I thought was going pretty well was actually not going as well as I thought. I also have some concrete ideas on what to do next year. The main takeaways for me are: go slower, bring in more visual understanding for trig equations, don’t mess around with the harder stuff, get a lot of formative feedback on the basic types of problems, and make the assessment shorter than my intuition tells me.
*Okay, to be fair, I have given them two things — one which we proved later, the other which I never proved. (The former was the sum of angles formula for sine and cosine, the latter was Heron’s formula.)
[1] It was a stressful time when I was doing this unit, and so I just didn’t have time to come up with anything better. But still, I think they get at good stuff. Even if there needs to be A LOT MORE GRAPHING next year. We did a lot of graphing when we did basic trig equations. We should have done graphing here too.
[2] The kicker is that I said in class that figuring out the correct sign is the most important thing about applying that formula. Multiple times. But me saying it until I’m blue in the face the same as them totally understanding it. Next year I need to build in some warm up questions like: if  , what quadrant is
  in? Draw a picture. If
  is in the fourth quadrant, explain in words and with pictures why
  is in the second quadrant..
gives rise to ellipses if


 This is equivalent to shining a flashlight at a wall at an angle:

 [1] give rise to all the conic sections by varying the parameter
  . In other words, you can see all conics as a family of curves with a varying parameter.

 , I wonder if there’s a relationship between the value of
  to rectangular coordinates, so this will be a bit of review.)
 that the graph is a parabola, I had them graph
  to confirm that it wasn’t… and then they had to zoom out to see it truly was an ellipse. Or if they said that very high values of
  and
and  equivalent expressions?” I have something pulling me in that direction too, saying that must be part of the “big idea” but haven’t quite been able to incorporate.
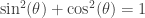 ? So elegant! So coming up with equivalent expressions using the unit circle would be amazing for me. Anyone out there have this already done?


 is negative and when
  is negative. And then they do some plotting, and then convert from polar coordinates to rectangular coordinates. Most importantly, they figure out how to do these conversions on their own.
  , what does that mean about the
  coordinate? (“It can be ANYTHING! There is no restriction placed on
  , I hope they say “well
  , but the angle can be anything” (and similarly, for
  , “I suppose
  , but
, but